



Key Takeaways
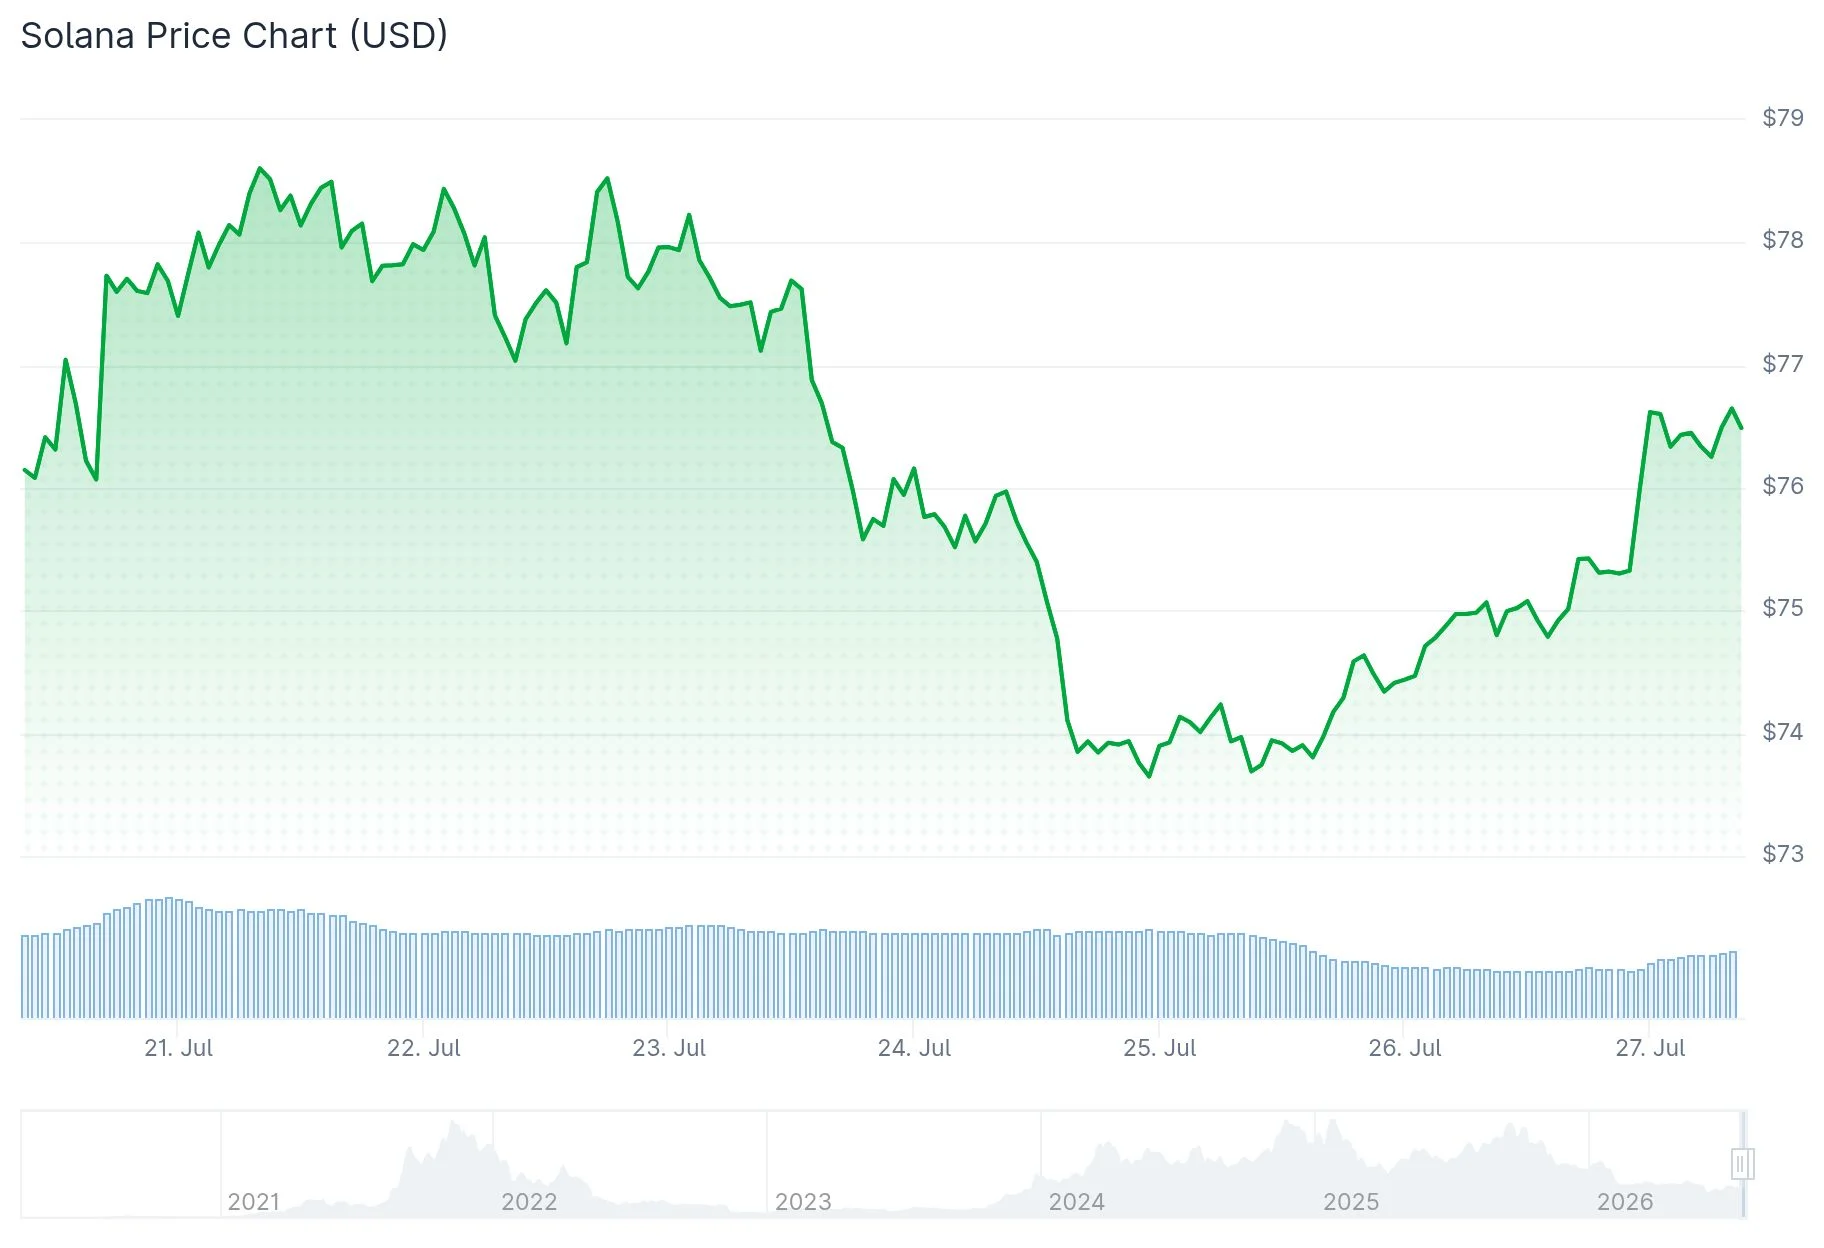
- SOL currently trades near critical support at $73, aligned with the 0.382 Fibonacci retracement level at $73.89
- Breaking above $77 resistance would signal bullish momentum toward the $80-$84 range
- A failure to hold $73 support could push prices down to the $68-$64 area, with June’s $60 low as the worst-case scenario
- Crypto analyst Crypto Patel highlights the $52-$73 range as a strategic long-term accumulation zone on weekly timeframes
- Ambitious price projections of $500 and $1,000 remain possible but require several significant resistance breakouts
Solana finds itself at a critical juncture in the market. Trading around $73.90, the cryptocurrency is testing support just above the 0.382 Fibonacci retracement level at $73.89 while simultaneously defending an ascending trendline that has provided support since June.
Crypto analyst Crypto Patel has been closely monitoring this pivotal price level. According to his analysis, maintaining support above $73 preserves the bullish market structure, whereas a breakdown could send SOL tumbling toward the $68-$64 liquidity zone.
Throughout the recent recovery phase, buyers have successfully defended this upward-sloping trendline on multiple occasions. This historical defense adds credibility to the support level, though Solana faces significant challenges to the upside before any sustainable rally can materialize.
Currently, SOL remains capped by a descending resistance trendline that originates from the July peak around $84. This downward-sloping pressure continues to suppress near-term recovery efforts.
Why $77 Is the Critical Breakout Level
Reclaiming the $77 level would mark a significant shift, pushing Solana above the descending resistance trendline. Successfully breaking this barrier would open the path toward $80, with $84 as the subsequent target.
Should the $73 support level fail, attention turns to the 0.5 Fibonacci retracement near $71. Further deterioration would expose the $68.22-$64.46 support zone, and a decisive break beneath $64.46 could send prices retreating toward the June low around $60.
Crypto Patel has also published a weekly chart analysis that paints a broader picture. On this extended timeframe, SOL currently sits near $74, marginally above Fibonacci support around $72.55, with a wider support zone extending down to approximately $52.
Maintaining price action within the $52-$73 range would preserve the long-term bullish structure. However, a sustained breakdown below $52 could potentially drag prices toward $32.50.
Ambitious Price Targets: $500 and $1,000 in Focus
Examining the weekly timeframe, Crypto Patel outlines potential price targets of $500 and $1,000 if SOL completes a full breakout sequence.
The initial major obstacle sits at $101. Beyond that level, Solana must contend with substantial resistance between $180 and $295, a range that encompasses the territory around its previous all-time high.
Only after a confirmed breakout above that resistance zone would the $500 target become realistic. The $1,000 projection would represent an extraordinary gain of approximately 1,900% from the lower boundary of the support zone.
These ambitious targets are predicated on Solana replicating a historical breakout-and-retest pattern. At the current price near $73-$74, SOL remains in the accumulation and support phase rather than an expansion phase.
The latest market data shows Solana trading near $73.90, with the immediate decision point revolving around whether buyers can successfully defend the $73 level amid ongoing selling pressure.

