



TLDR
- SOL is trading near $108.79, down about 3.47% over the past 24 hours after pulling back from $112.39.
- A market structure break above $96 has shifted the technical setup toward a bullish recovery scenario.
- Solana is testing weekly VWAP resistance around $115, with a close above this level seen as a key confirmation signal.
- Daily active stablecoin addresses on Solana hit roughly 888,000 in September, up 269% from a year earlier.
- A break above $115 could open the path to $125 and then $140-$145, while losing $96 would expose $80-$90.
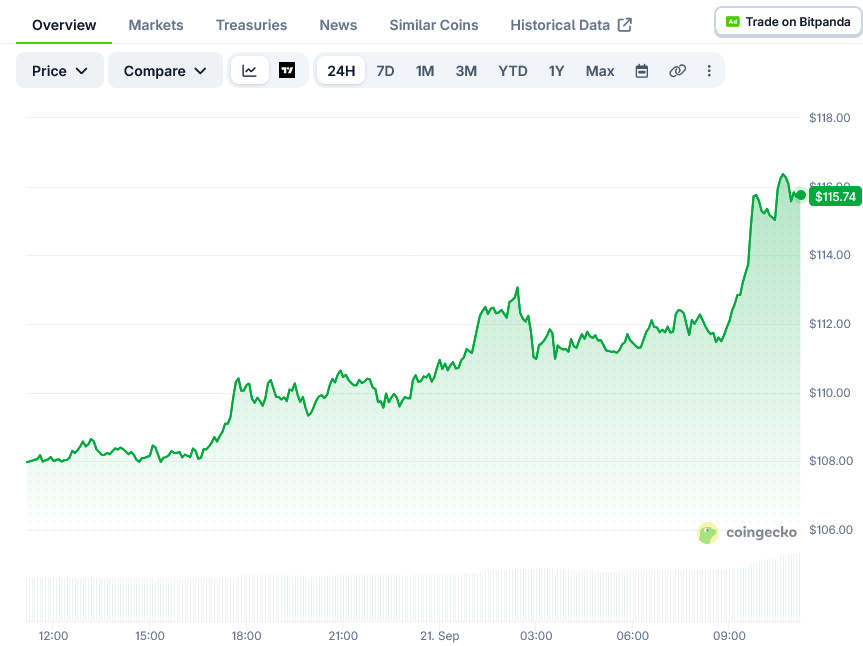
Solana price is trading around $108.79 as of September 20, down about 3.47% over the past 24 hours. The pullback came after SOL touched $112.39 and is now testing short-term support near $107.50.
Traders are watching whether buyers can hold this level or whether a deeper correction is ahead. The $112-$115 zone remains the main resistance standing in the way of further gains.
Solana has broken its previous bearish market structure by moving above a former lower high near $96. This shift suggests buyers are starting to take back control after the earlier decline.
Chart analyst HK pointed out that SOL is now trading above its former breakout level, with a possible retest of the $80-$96 demand zone before another push higher. Holding that region would keep the bullish structure intact.
The next resistance cluster sits between $125 and $145, an area where past selling pressure has appeared. A move into this zone would support the case for a longer-term reversal.
Weekly VWAP Resistance Comes Into Focus
Solana is also testing a weekly VWAP resistance level. Analyst DocXBT shared a chart showing SOL near $112.91, just under the $115.58 resistance line where the upper VWAP band currently sits.
Price has recovered from the $60-$80 range and is now pressing against the descending upper band. A weekly close above $115 would strengthen the case for a broader trend change.
If SOL is rejected at this resistance again, the price could fall back toward the $80-$90 demand zone. For now, the recovery is intact but not yet confirmed on higher timeframes.
On-Chain Activity Hits a Record High
Solana’s network usage is also climbing. According to data shared by Solana, daily active stablecoin addresses reached about 888,000 in September, up 269% from 333,000 a year earlier.
This growth adds a fundamental backdrop to the technical recovery, though it does not guarantee a price move on its own. SOL still needs to clear resistance near $115 to convert this activity into sustained buying pressure.
On the short-term chart, immediate support sits at $107-$108. Below that, $102-$104 and $97-$100 mark the next levels tied to the prior consolidation range.
Key resistance remains at $112-$114. A move above this zone would bring the recent high back into play and support the case for further upside.
If SOL holds $100-$105 and clears $115, the next targets become $125 and then the $140-$145 supply zone. A break below $96 would shift focus toward the $80-$90 demand region instead.
As of the latest update, Solana remains inside the $100-$115 range, with the next move likely to be decided by whether buyers can defend current support levels.

