



Key Takeaways
- SOL currently hovers near $76, testing a crucial support zone that may determine its upcoming trajectory
- Approximately $26 million worth of cross-chain assets entered the Solana network during the last week
- Maintaining the $74–$75 support zone remains critical for bulls to sustain upward momentum
- Successfully breaking through $82–$85 resistance could pave the way toward $94, followed by $125
- A breach of current support levels may send SOL tumbling into the $64–$70 territory
At press time, Solana (SOL) trades at $76.17, commanding a market capitalization of $44.4 billion alongside a 24-hour trading volume of $1.8 million.
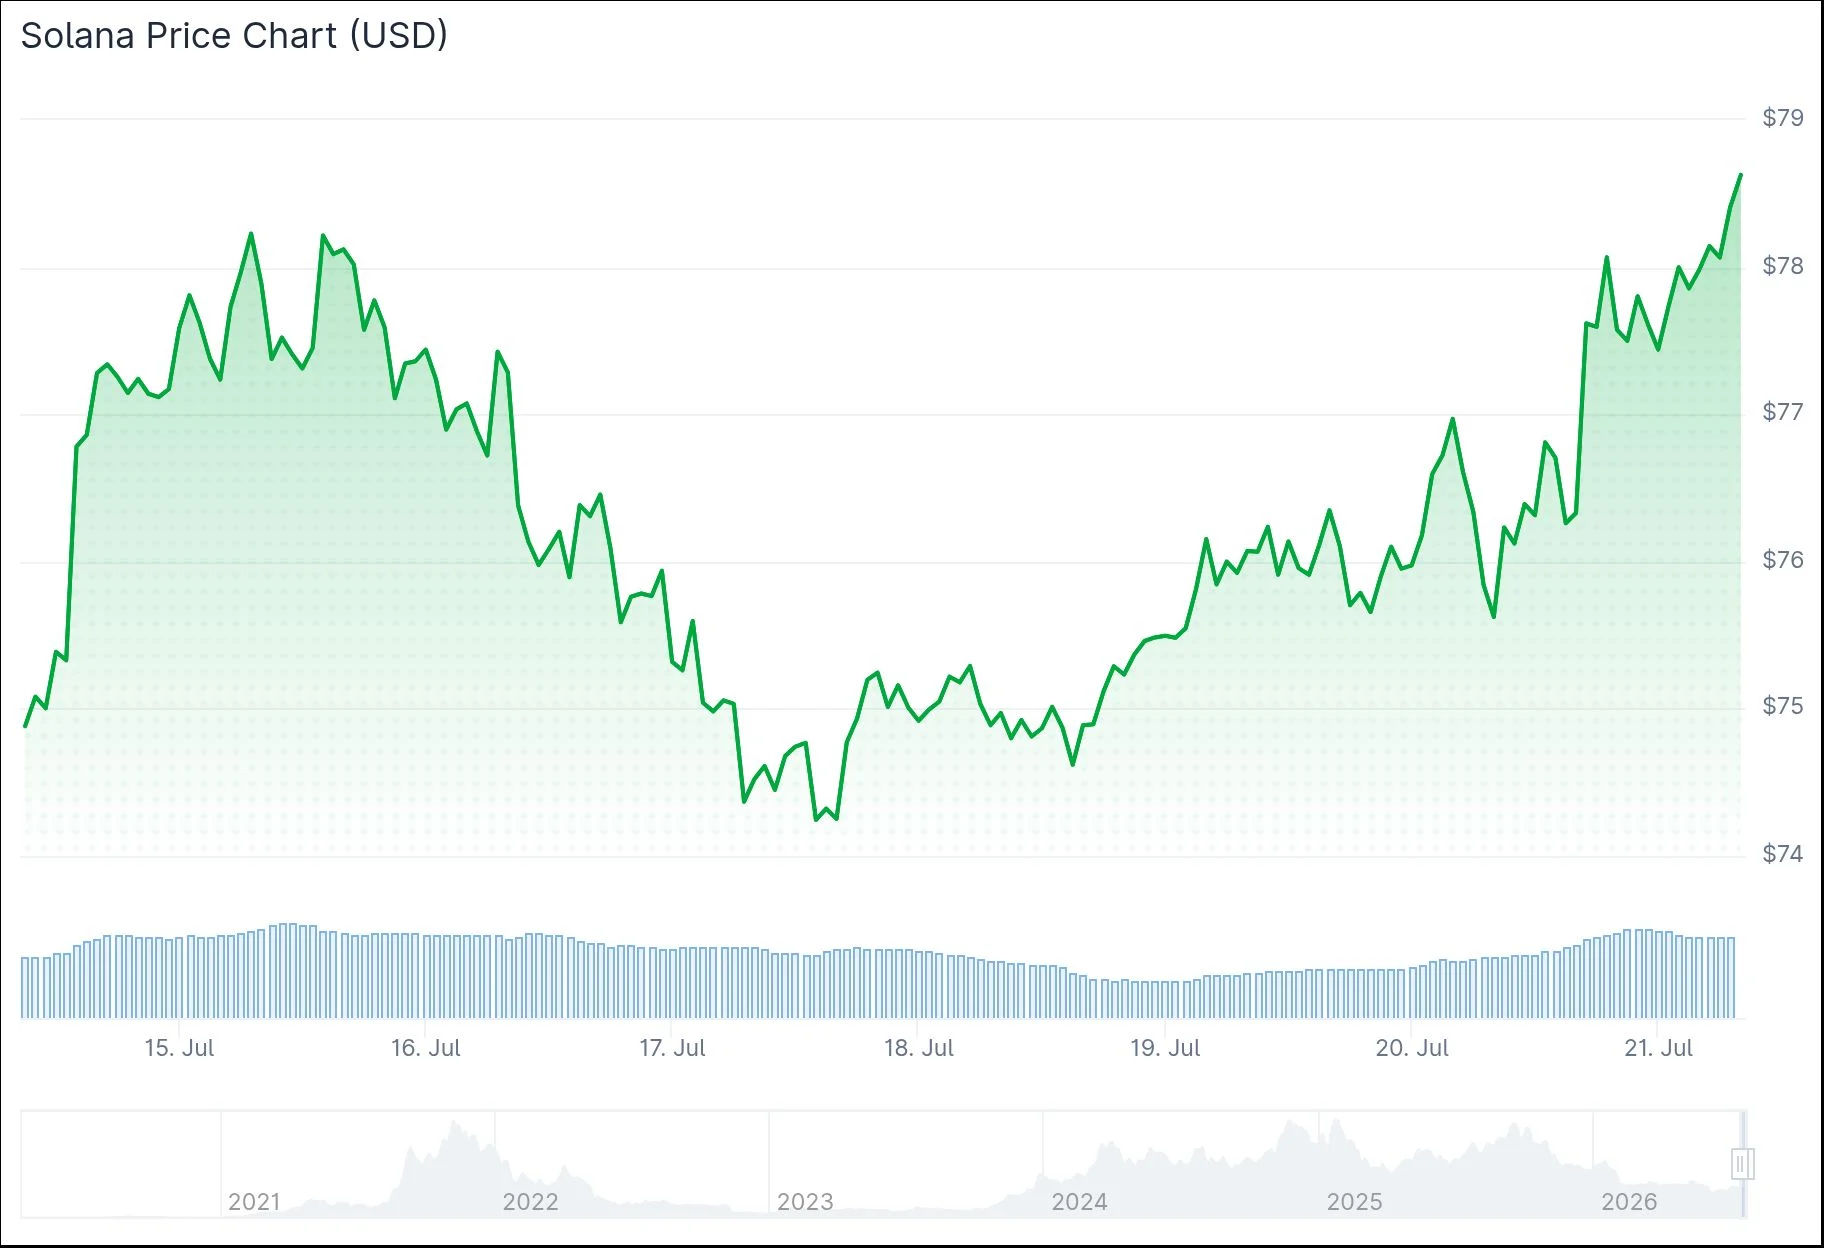
The digital asset has been consolidating around a critical support threshold, with its future direction largely contingent upon whether bulls can successfully defend this strategic level.
Market analyst Daan Crypto Trades highlighted that SOL is nearing a pivotal high-timeframe technical juncture. According to his assessment, buyers must protect the existing level and establish a higher low to preserve the bullish framework.
Should buyers succeed in defending this position, the immediate resistance target emerges around $97, representing the upper limit of the prevailing trading corridor.
Conversely, should this support crumble, market watchers anticipate SOL could retreat to the mid-$60s region, where prior buying interest materialized. More precisely, the $64.69 threshold has been identified as a significant support floor beneath current valuation.
Wave Pattern Analysis Suggests $82–$94 Trajectory
Examining the hourly timeframe reveals SOL testing the 38.2% Fibonacci retracement level around $74. Under an optimistic interpretation, this represents the conclusion of a corrective retracement before initiating another upward movement.
Initial resistance materializes between $78.40 and $82.30. Clearing this barrier decisively would establish objectives in the $89–$94 range.
Should price action fall beneath $74, the correction might extend toward $71.17, potentially reaching $68.42.
Cross-Chain Capital Injection Totals $26M
According to metrics from Solana Floor, over $26 million in digital assets have been bridged onto the Solana blockchain throughout the preceding seven-day period.
Such capital migration indicates revitalized attention toward the platform. Solana’s rapid settlement times, minimal transaction costs, and thriving decentralized finance infrastructure continue drawing liquidity from competing blockchains.
Cryptocurrency analyst Crypto Patel expressed his perspective on X, cautioning that failure to maintain the present ascending channel could trigger a descent toward the $70–$50 accumulation territory. He emphasized maintaining long-term conviction in SOL eventually reaching $500, then $1,000, characterizing the $70–$50 band as a compelling accumulation opportunity for strategic investors.
Analyzing the weekly timeframe, Solana continues defending a support region around $75 that previously catalyzed an explosive advance toward $140. The weekly Relative Strength Index demonstrates ascending lows near support boundaries, suggesting bearish pressure may be diminishing.
The 20-week exponential moving average positioned near $85 represents the initial obstacle, trailed by a resistance concentration spanning $110–$125. Surpassing $125 would place the annual opening price near $143 within reach.
The $26 million weekly cross-chain capital injection stands as the latest metric validating sustained ecosystem engagement across the Solana network.

