


TLDR:
- XLM price rose 3.79% to $0.1985 on September 19, after Stellar activated Protocol 28 and recorded 211 transactions per second across 100 blocks.
- Stellar reports about $3.3 billion in tokenized real-world assets, nearly $884 million in stablecoins, and around $294 million in decentralized-finance value.
- The $0.197 level and the middle Bollinger Band near $0.19277 form the immediate support areas in the current short-term XLM trading structure.
- XLM trades above its middle Bollinger Band, while the $0.21832 upper band and $0.21 to $0.22 range mark higher technical areas.
XLM price moved back toward $0.20 on September 19 after Stellar activated Protocol 28 two days earlier. The token traded at $0.1985, gaining 3.79% over 24 hours. Trading volume reached about $568.96 million, while market capitalization stood near $6.99 billion.
The move followed a rebound from lower September levels and put $0.20 in focus. Protocol 28 introduced consensus tooling and contract-migration capabilities. It also recorded 211 transactions per second across 100 blocks.
Traders also closely tracked a possible pullback toward $0.197. Holding that region could clarify whether short-term buyers retain control. Total crypto capitalization rose 1.6%, while altcoin capitalization increased 1.2%. XLM outperformed the broader market during that period.
XLM Price Gains Focus After Stellar Protocol 28 Activation
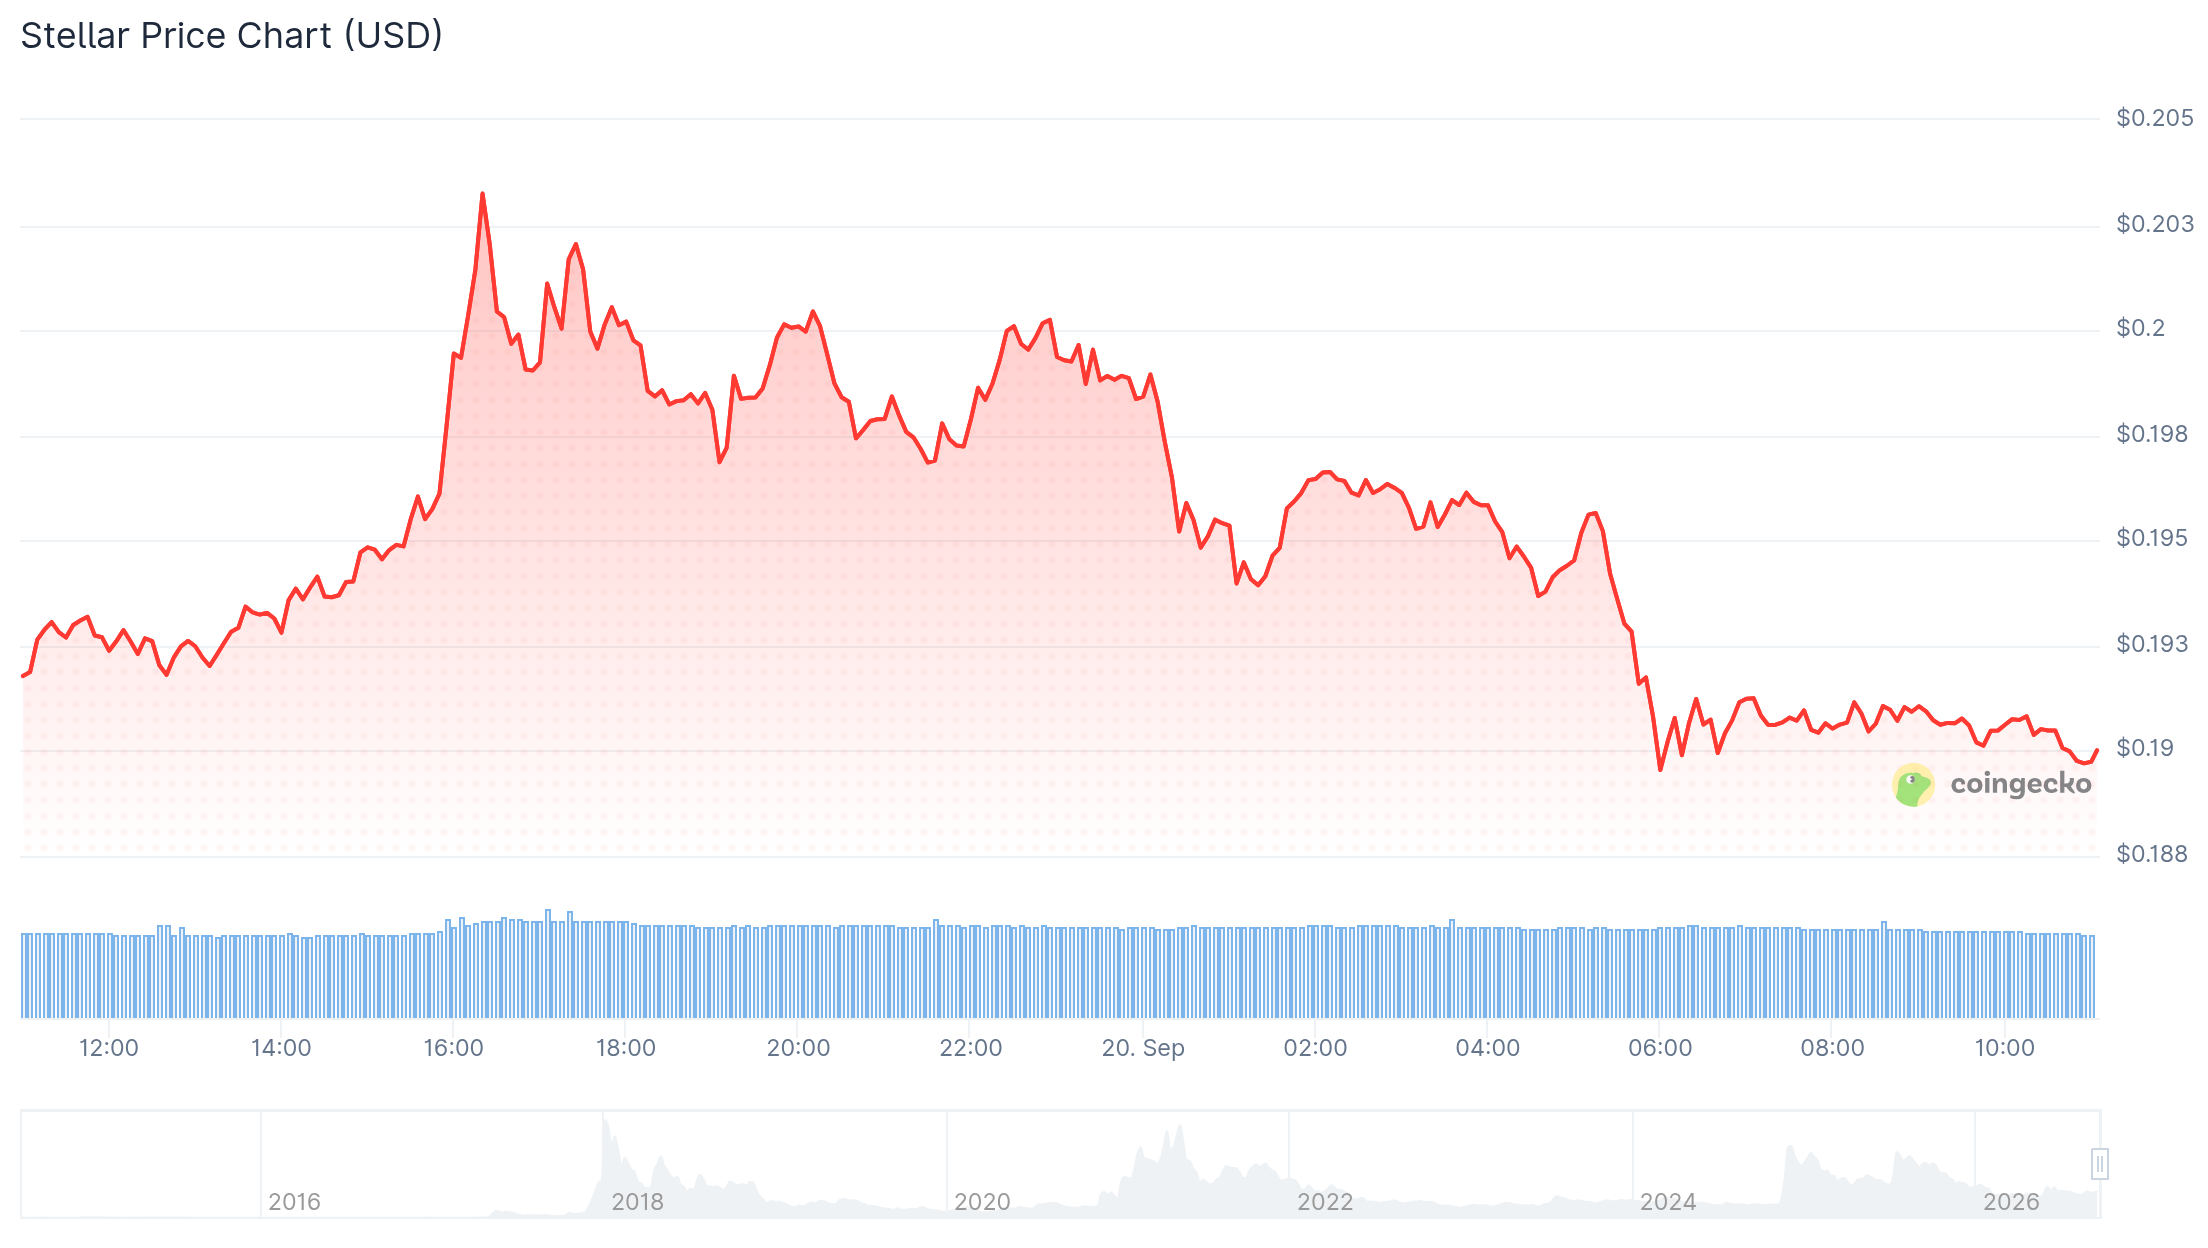
Stellar activated the upgrade on September 17, adding consensus changes and contract-migration tools. The network recorded 211 transactions per second through a 100-block test period. XLM Price gained roughly 4% around activation and traded near $0.186. The timing aligns with the upgrade, though several factors can influence price action.
Protocol 28 supports Soroban development as projects prepare contracts for newer network functions. It gives developers a clearer route for moving existing contracts. Stellar processes payment and asset-issuance activity alongside token trading. Later phases could target throughput above 3,000 transactions per second.
Stellar supports about $3.3 billion in tokenized real-world assets. It also carries nearly $884 million in stablecoins and roughly $294 million in decentralized-finance value. Those measures place the upgrade within broader infrastructure activity. Franklin Templeton and Ondo have used Stellar for tokenized asset initiatives. This activity feeds the network’s real-world asset narrative.
XLM and XRP moved more than 8% during earlier positioning around US crypto market-structure legislation. The advance showed sensitivity to policy developments. Still, legislation does not set the token’s immediate technical direction.
The International Monetary Fund has published 2026 research on tokenized finance, stablecoins, and tokenized money. Its work identifies faster settlement and lower reconciliation costs as possible benefits. It also flags liquidity, interoperability, and financial-stability risks. The research does not endorse individual networks or tokens.
Bollinger Bands Define Key XLM Support and Resistance Levels
Before the recent rebound, the token traded in the mid-$0.15 range. Its return toward the 200-day moving average put the $0.188 to $0.190 zone under scrutiny. A hold above that range would keep attention on the $0.20 threshold. XLM Price now depends on buyers defending nearby levels after the breakout.
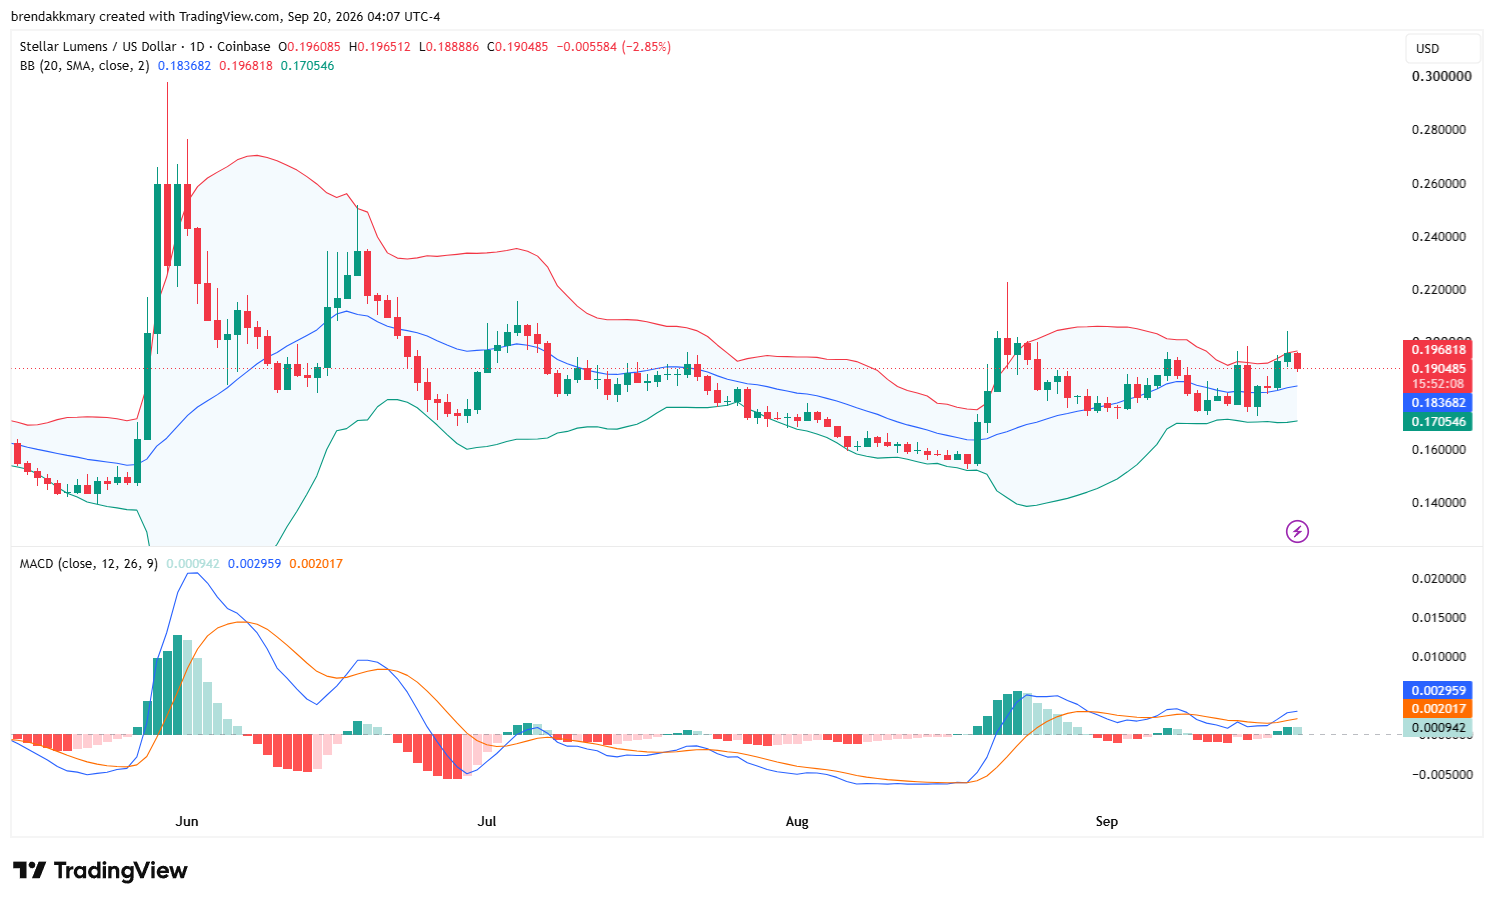
XLM price traded above the middle Bollinger Band near $0.19277. That positioning places the recent range midpoint in focus as potential support. The upper Bollinger Band stands near $0.21832, while the lower band sits around $0.16922. A move toward the upper band would extend the recovery from earlier September weakness.
Momentum indicators also show a firmer short-term structure. The MACD line stood at 0.00313, above its 0.00185 signal line. Its positive 0.00128 histogram shows buying pressure improved from weaker prior sessions. Momentum can change quickly if price returns below the middle band.
The $0.197 level features prominently in the immediate setup. Market commentator Udy Highs identified it as a possible long-entry area after a retracement. A retest that firmly holds could keep buyers focused on $0.20 and the upper band. XLM Price faces a separate test if it loses the midpoint near $0.19277.
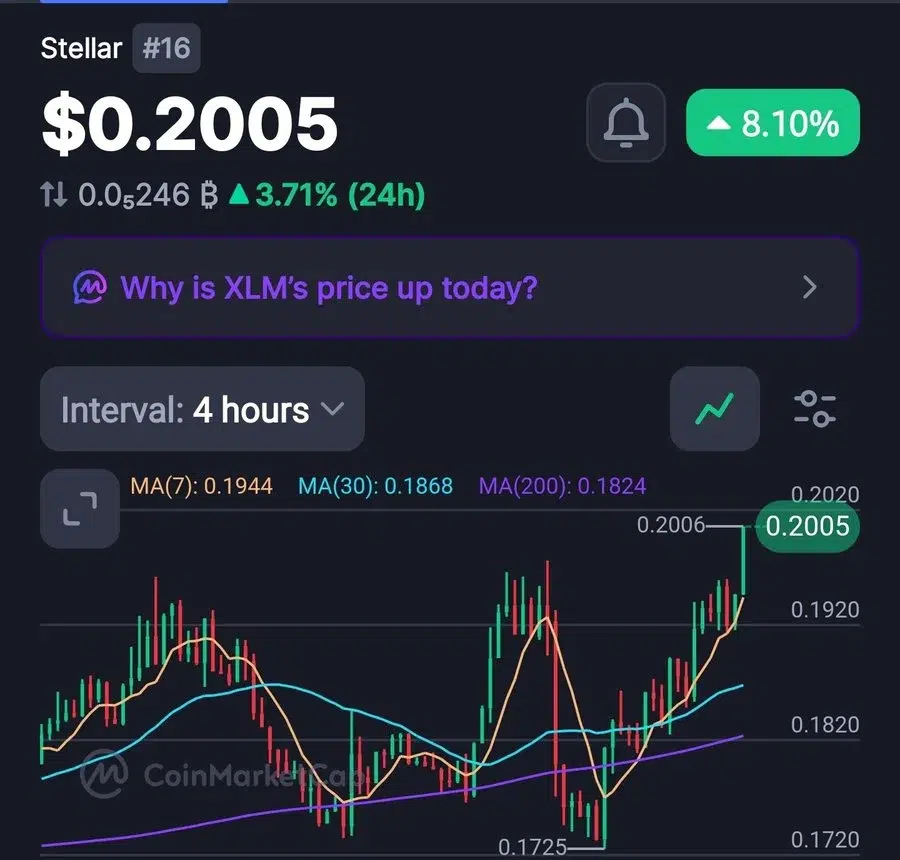
That break could shift attention toward support between $0.176 and $0.182. A sustained move through $0.20 instead puts the $0.21 to $0.22 zone in focus. Derivatives positioning adds another layer to the near-term move. Long-to-short ratios near 1.15 and positive funding rates show growing long exposure. That positioning can amplify sharp moves after network news or broad market shifts.

