



Key Highlights
- Large XRP holders removed 122 million tokens (approximately $170.8M) from Binance on May 22, marking the biggest single-day withdrawal since February.
- Market participants are closely monitoring the $1.35–$1.40 price corridor as a potential accumulation area, with significant withdrawal activity occurring around these levels.
- American spot XRP ETFs have maintained a 16-day streak of positive capital inflows, accumulating $116.75 million in total.
- Technical analyst ChartNerd cautions that a breach below $1.30 could trigger a decline toward the lower $1 range.
- Bollinger Bands have compressed to levels not seen since mid-2024, with past patterns suggesting a potential price swing of 58%–82%.
XRP currently hovers around $1.35 while significant whale movements and ETF capital flows capture market attention.
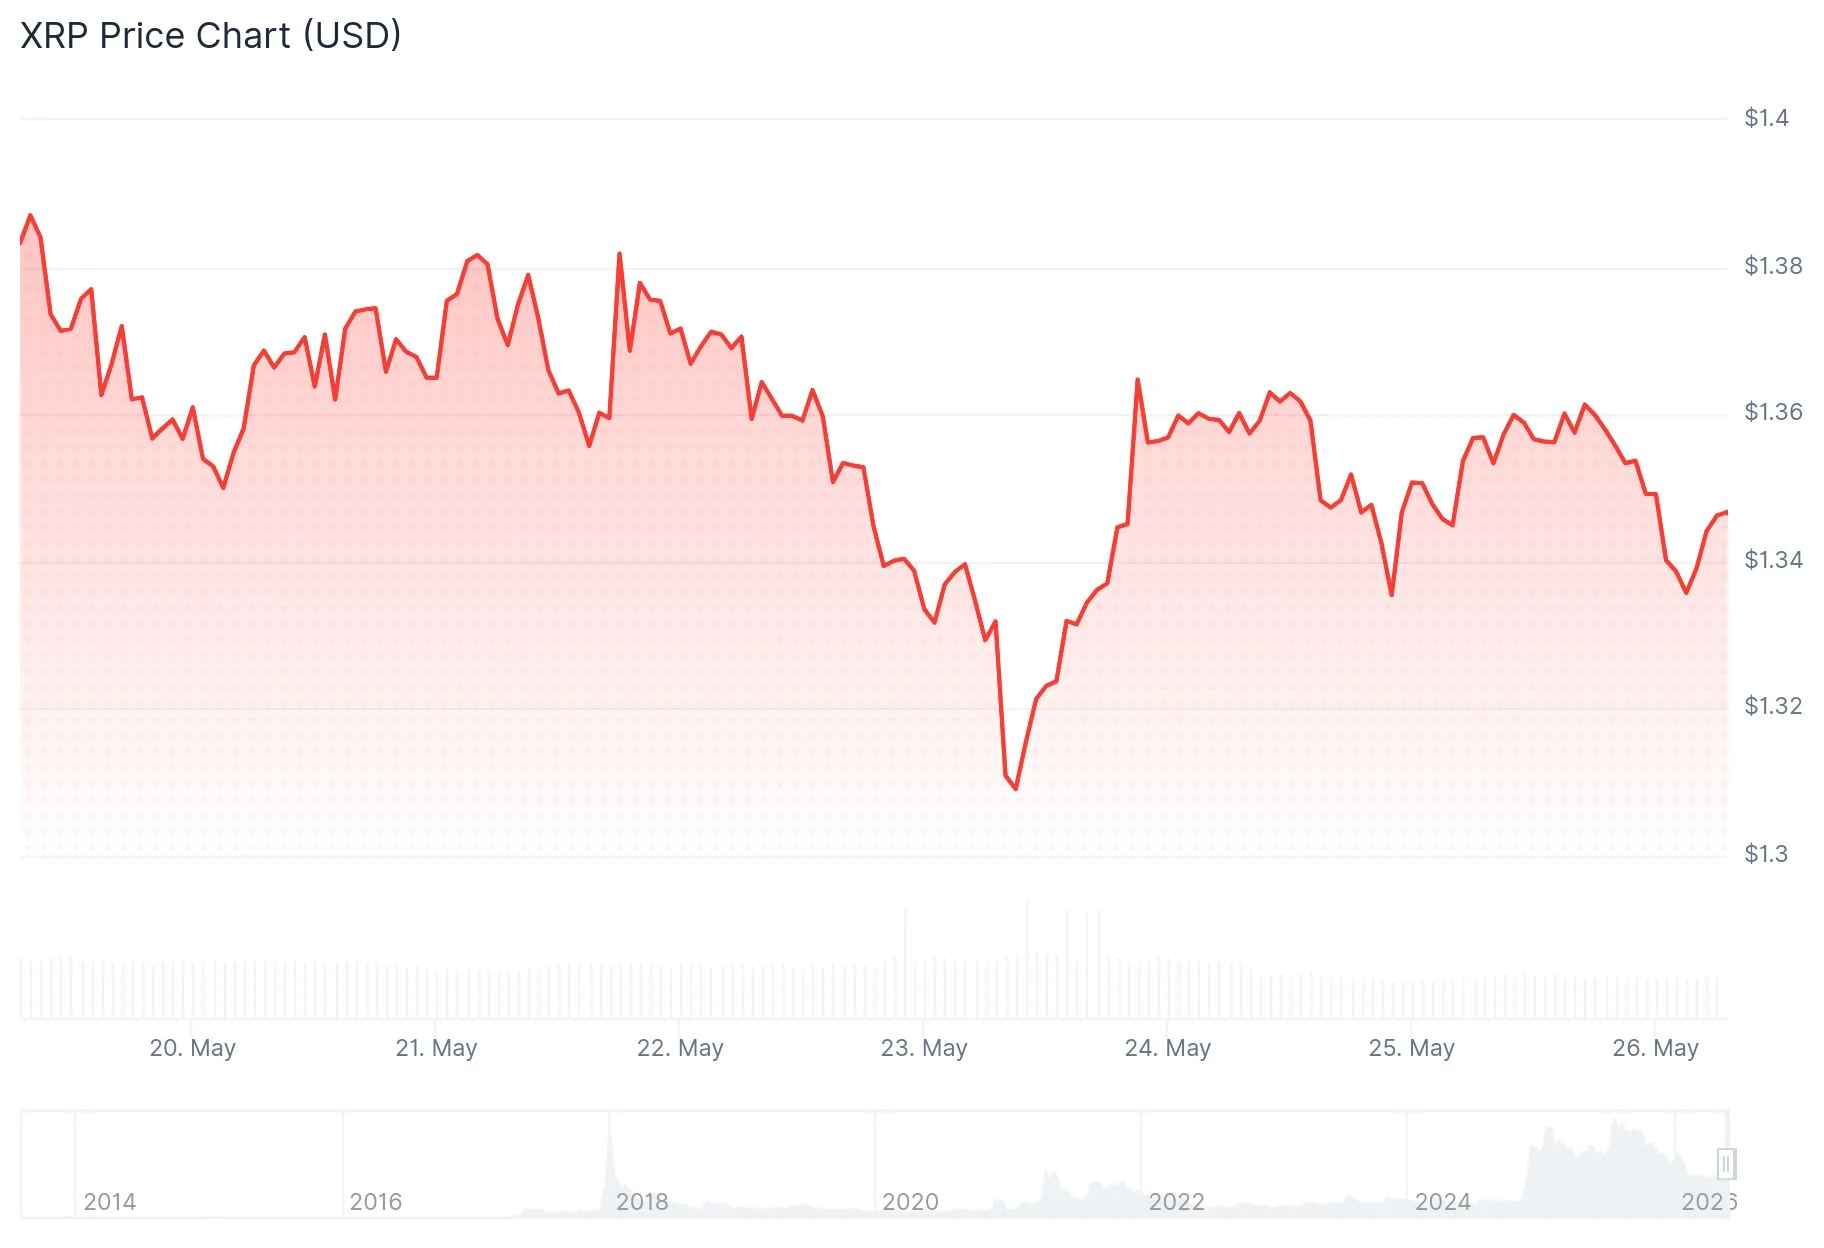
Blockchain analytics from CryptoQuant revealed that on May 22, 122 million XRP tokens—valued at approximately $170.8 million—were pulled from Binance within 24 hours. This represents the most substantial single-day outflow exceeding 100 million tokens since early February, when 278 million XRP left the exchange.
CryptoQuant’s analyst Amr Taha observed that the February withdrawal surge coincided with XRP trading around $1.43, whereas the recent activity occurred closer to $1.35. He suggested that consistent withdrawal patterns near similar price points might indicate that institutional players view this range as an attractive entry opportunity.
Simultaneously, XRP’s net exchange position change dropped to -$30 million on the same date—the most negative figure recorded since April 9, when the token traded near $1.28. That April decline preceded a 17% rally to $1.51 by April 17.
ETF Capital Flows Add Momentum
US-based spot XRP exchange-traded funds have maintained uninterrupted positive inflows across 16 consecutive trading sessions, accumulating $116.75 million throughout this stretch. This persistent institutional demand from American investors represents an additional supportive factor for the digital asset.
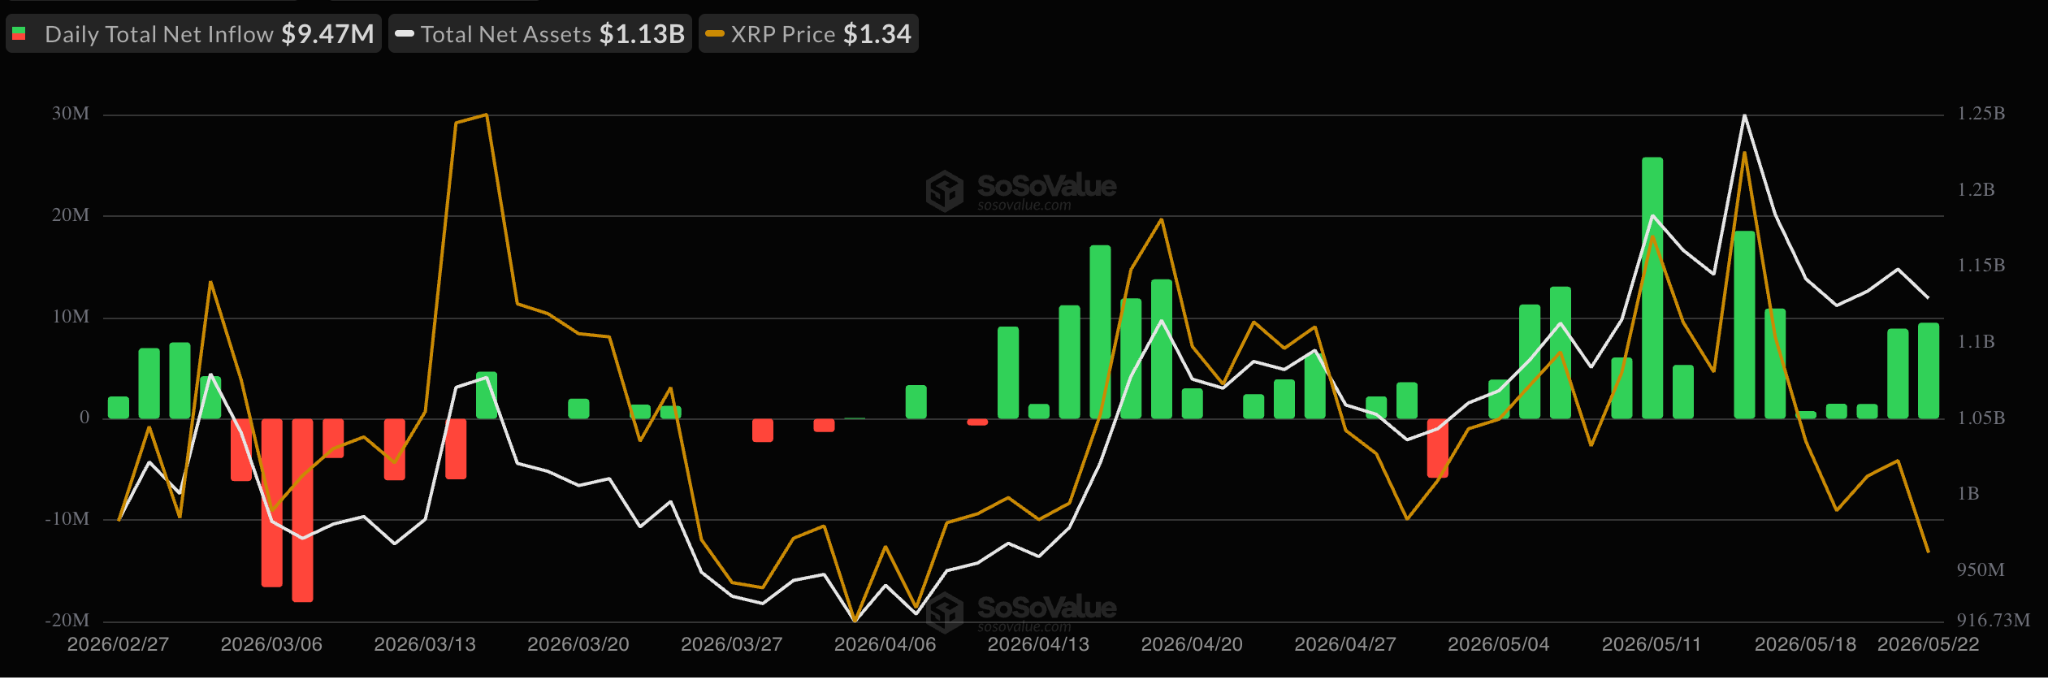
The combination of tokens leaving exchanges and steady ETF capital inflows suggests decreasing available supply on the selling side.
Concurrently, data from Santiment indicates XRP’s social sentiment has shifted decidedly negative, with merely 1.1 positive remarks for every negative comment. Santiment highlighted that historically, such periods of widespread fear and doubt have frequently served as contrarian indicators, with previous ventures into what the firm terms the “FUD zone” often preceding price stabilization or upward reversals.
XRP has remained confined within a $1.30 to $1.50 corridor since early February. Market analyst ChartNerd identified $1.30 as the “current guardrail,” cautioning that a decisive break below this threshold could precipitate a decline into the lower $1 territory.
Technical Setup Points to Imminent Volatility
From a technical perspective, XRP’s Bollinger Bands have narrowed to their tightest configuration since mid-2024. Historical instances of similar compression have preceded price movements ranging from 58% to 82%, which would project a potential upside objective around $2.33.
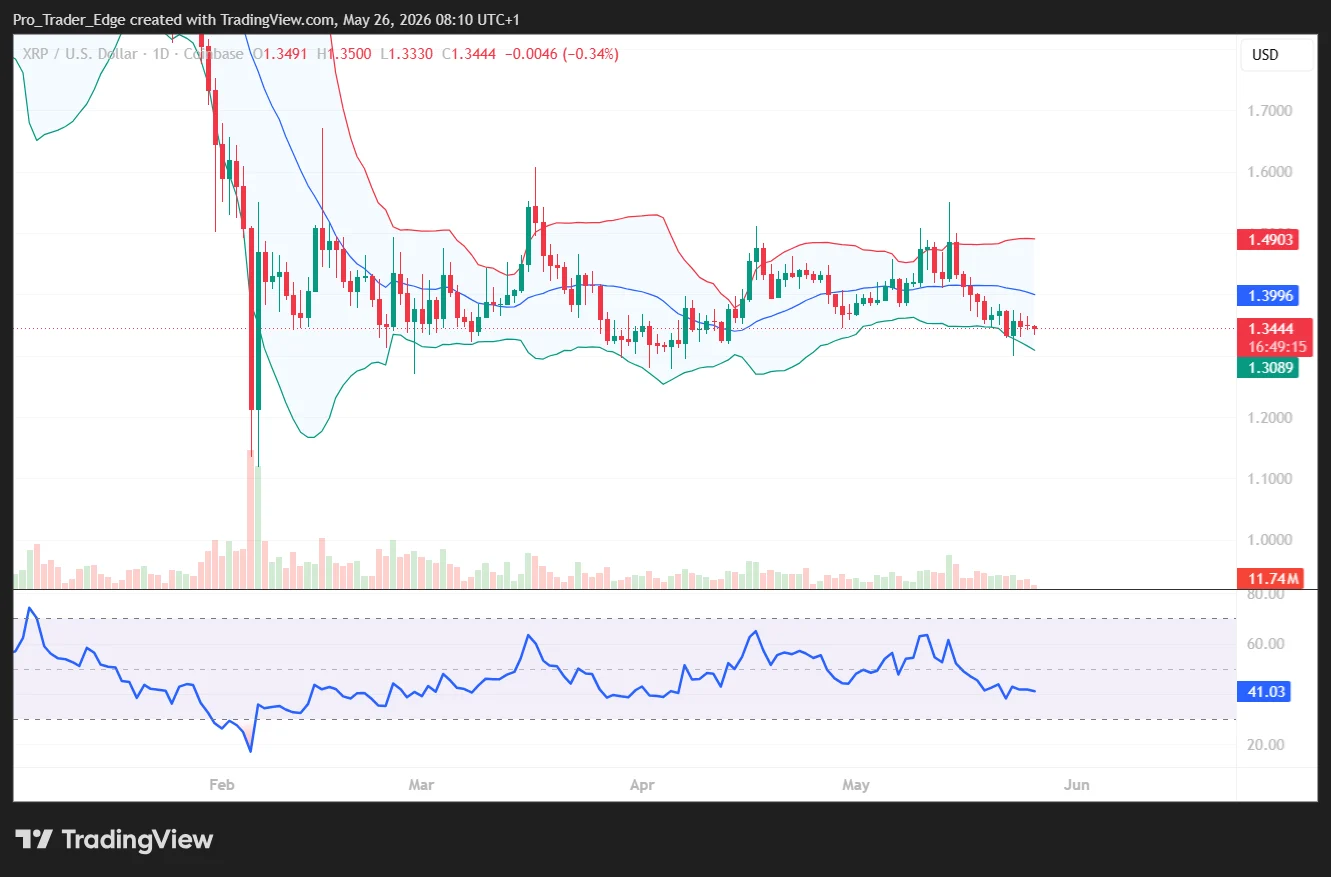
Analyst Crypto Patel drew parallels between the current consolidation pattern and the calm period preceding XRP’s late-2024 breakout, establishing a longer-term price objective of $10.
As of May 26, XRP trades beneath $1.3580 and remains under its 100-hourly simple moving average. Immediate resistance appears at $1.360, followed by additional barriers at $1.3720 and $1.380. Conversely, support levels are established at $1.330, $1.3280, and $1.30.

