



Key Highlights
- XRP declined 1.29% to reach $1.0476 on August 6, piercing below critical triangle pattern support
- Technical support at the Bollinger Band lower edge ($1.0362) represents the final barrier before the psychological $1 threshold
- XRP spot ETFs experienced $3.58M in net outflows on August 5 — marking the first negative trading day since July 8
- Futures market data reveals long positions suffered $5.92M in liquidations compared to only $120K for short positions
- Technical analyst ChartNerd highlighted August’s historical weakness for XRP, suggesting any late-month pullback offers strategic entry points
XRP experienced a 1.29% decline to $1.0476 during Wednesday’s trading session on August 6, marking its fourth straight day of losses. Throughout the 24-hour period, the digital asset fluctuated between $1.04 and $1.07, while maintaining a market capitalization hovering around $65.5 billion.
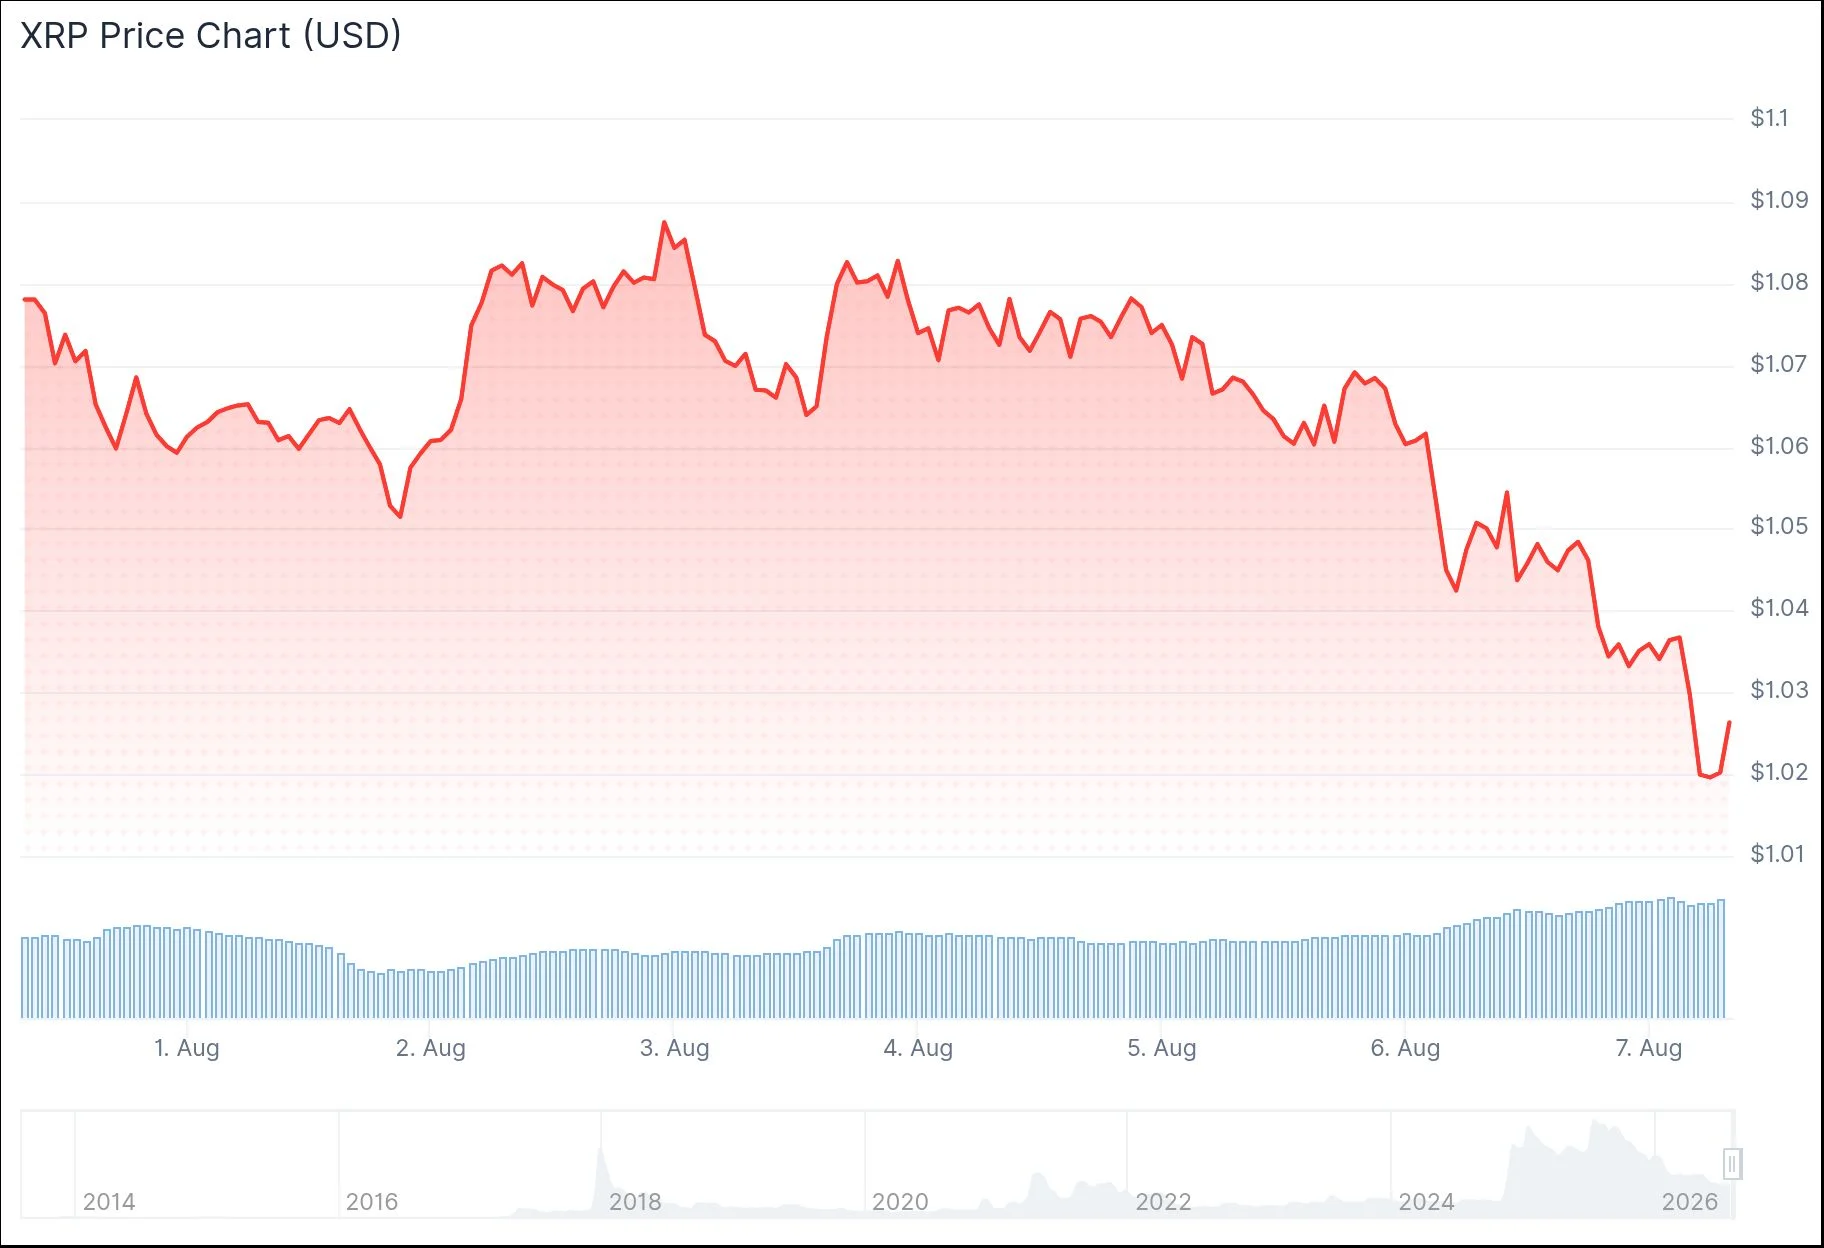
Currently, the asset trades approximately 71% beneath its record peak of $3.65 established on July 17, 2025. This significant retracement has intensified scrutiny on critical support thresholds.
Technical analysis of the daily timeframe reveals XRP breaching the lower boundary of a triangle consolidation pattern that had been developing since May’s peaks above $1.50. The converging trendlines, which had been narrowing for several months, saw the lower support finally give way during Wednesday’s session.
The Bollinger Band’s lower boundary positioned at $1.0362 currently serves as the last significant technical support separating current valuations from the psychologically important $1 mark. Should a daily candle close materialize below this threshold, it would expose the round-number support at $1 to immediate testing.
Exchange-Traded Fund Outflows Intensify Bearish Sentiment
XRP spot exchange-traded funds registered $3.58M in net redemptions on August 5, representing the first outflow session observed since July 8. Bitwise’s XRP investment vehicle accounted for the entirety of the capital withdrawal, while competing products showed no activity.
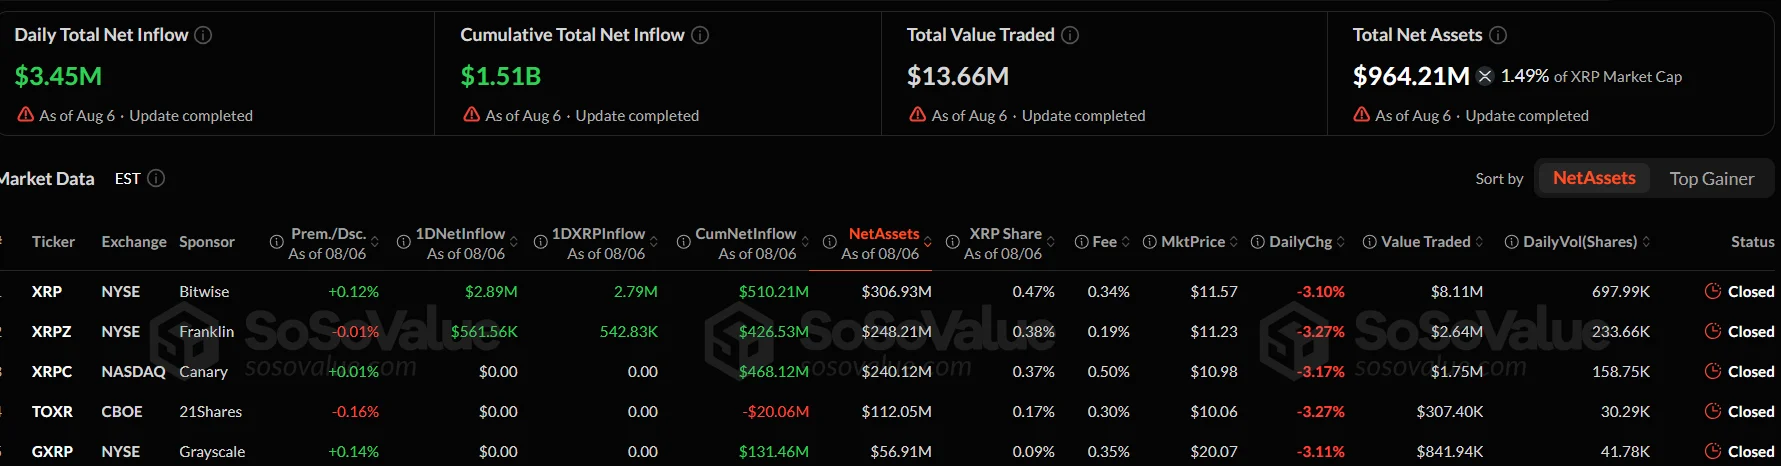
Aggregate net inflows spanning all five ETF offerings stand at $1.51B, while combined net assets total $993.38M. This outflow session interrupts multiple weeks of subdued yet positive capital flows observed throughout July.
The Relative Strength Index currently reads 39.47, positioned beneath its moving average of 44.14. Meanwhile, the MACD indicator remains in negative territory, confirming persistent downward momentum.
Market Commentary and Futures Market Insights
Crypto analyst EGRAG CRYPTO characterized the $1.05 level as support territory but cautioned it doesn’t constitute “confirmation,” instead identifying $1.11 as the initial indicator of bullish strength. According to the analyst, a decisive three-day close with substantial volume above $1.50 would provide more convincing evidence of a market bottom.
Technical analyst ChartNerd shared observations on X platform that August maintains “the longest consecutive active losing streak of any calendar month” in XRP’s historical performance. The analyst emphasized that XRP commonly establishes local bottoms during the June-to-August window ahead of post-summer recoveries, characterizing any bearish closes during August’s closing weeks as “further opportunity” for accumulation.
Futures trading volume surged 51.62% to reach $2.06B. During the 24-hour measurement period, long position liquidations totaled $5.92M while short liquidations amounted to merely $120K.
21Shares, the firm managing the TOXR XRP ETF product, has announced intentions to transition to a revised FTSE benchmark arrangement approximately August 24, with plans to terminate its existing CF Benchmarks agreement by August 31.

