


TLDR
- Daan Crypto Trades identified a retest of the daily 200-day moving average.
- The analyst also highlighted the 61.8% Fibonacci retracement as a potential support level.
- A long-standing horizontal resistance zone remains important for any sustained recovery.
- Bitcoin dominance stood near 59.8% on CoinMarketCap’s November 6 dashboard.
- The Altcoin Season Index remained around 45, below its confirmation threshold of 75.
Altcoin capitalization is testing support after weeks of fading rallies, according to trader Daan Crypto Trades. In his November 6 analysis, he identified the daily 200-day moving average and 61.8% Fibonacci retracement. The test follows a decline from September’s local high. Daan said successive rebounds have struggled to hold. That leaves a long-standing horizontal zone as the next obstacle.
Reclaiming Resistance Matters More Than Touching Support
The 200-day moving average tracks the average index value across 200 daily sessions. The 61.8% Fibonacci retracement marks a potential reaction level within a previous market move. Daily averages are lagging indicators, while Fibonacci levels depend on the swing highs and lows chosen.
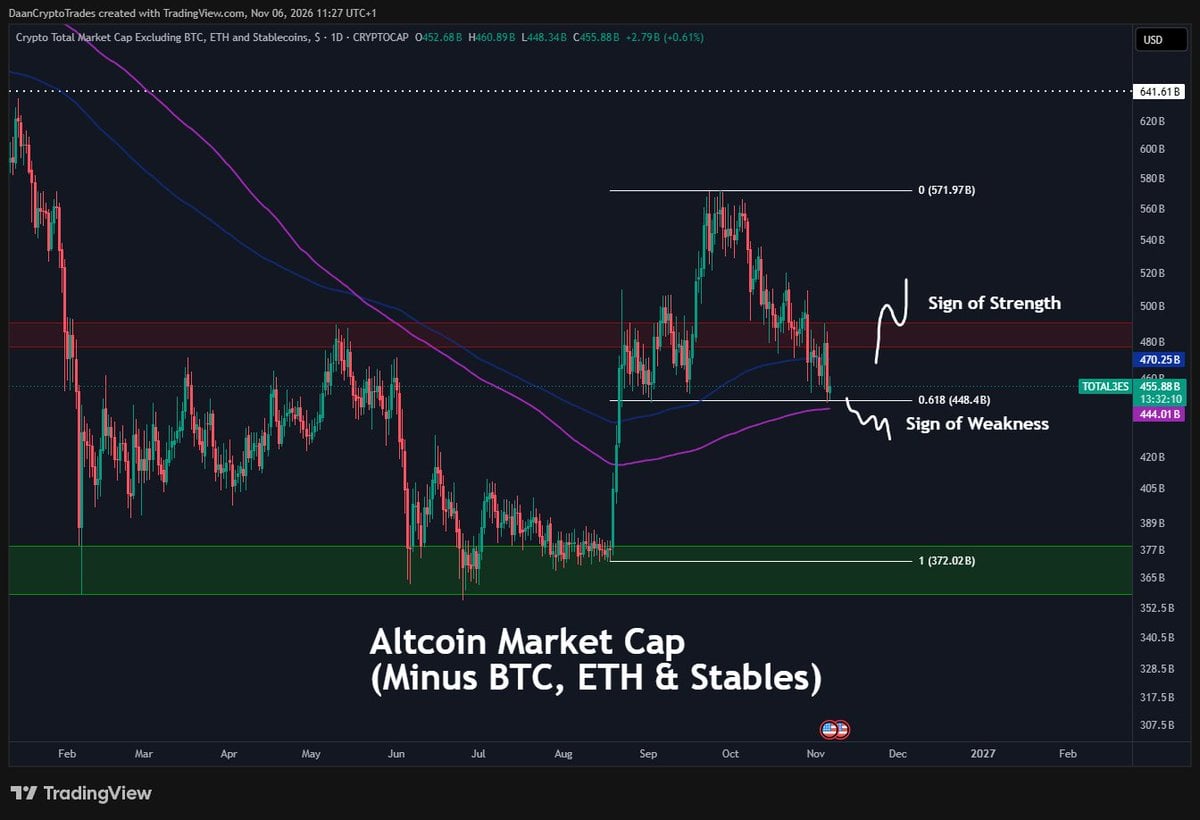
Their reported overlap makes the area technically notable. However, neither indicator independently confirms renewed buying or a trend reversal. Daan identified a nearby red zone that has alternated between support and resistance over several years. Reclaiming that zone would strengthen the bullish case, he argued.
Conversely, continued declines without a meaningful response would suggest that sellers retain control. Both outcomes remain conditional, with no guaranteed direction or timing. A recovery above the zone would also require follow-through. One brief move through resistance could reverse without establishing a sustained trend.
Broader Market Data Show Limited Altcoin Leadership
CoinMarketCap’s market dashboard showed Bitcoin dominance near 59.8% on November 6. Its Altcoin Season Index stood around 45 out of 100, below the confirmation threshold of 75. The index compares eligible cryptocurrencies against Bitcoin over the preceding 90 days. Its methodology excludes stablecoins and wrapped tokens, whose returns differ from those of volatile cryptocurrencies. The reading suggests that broad altcoin outperformance has not emerged. That distinction matters because rising capitalization alone would not establish an altcoin season.
Market values can rise without most individual tokens outperforming Bitcoin. Rising valuations also do not necessarily indicate equivalent new investment inflows. TradingView uses different measures for the altcoin market. TOTAL2 excludes Bitcoin, while TOTAL3 removes both Bitcoin and Ethereum. Separate versions exclude stablecoins.
Consequently, any numerical support target depends on the exact index selected. The analyst’s chart symbol and retracement anchors require confirmation before publishing precise capitalization levels.
TradingView warns that changes in index membership can produce jumps in aggregate capitalization. Those methodological effects differ from market-wide buying. Earlier, Blockonomi reported stronger altcoin trading activity in August. Yet that activity did not confirm a full altcoin season. Daily closes above Daan’s marked zone, accompanied by improving breadth, would support a stronger recovery interpretation.