




TLDR:
- Bitcoin fell 6.34% in 2025 and is down 15.65% in 2026, trading near $73,850 as of November 10.
- A recovery above the $87,500 opening price, an 18.5% gain, would prevent two straight losing years.
- The two-year decline totals about 21%, far below the 73.56% loss in 2018 and 64.27% drop in 2022.
- Measured from the $126,000 October 2025 peak, Bitcoin’s drop exceeded 50% after falling below $58,000.
Bitcoin annual losses may extend to a second straight year for the first time in the asset’s 18-year history. The cryptocurrency fell 6.34% in 2025 and has dropped another 15.65% in 2026.
It traded near $74,107 on November 11. To avoid back-to-back red years, Bitcoin must climb above its 2026 opening price of roughly $87,500 before December 31. Only 50 days remain for the market to complete that recovery this year.
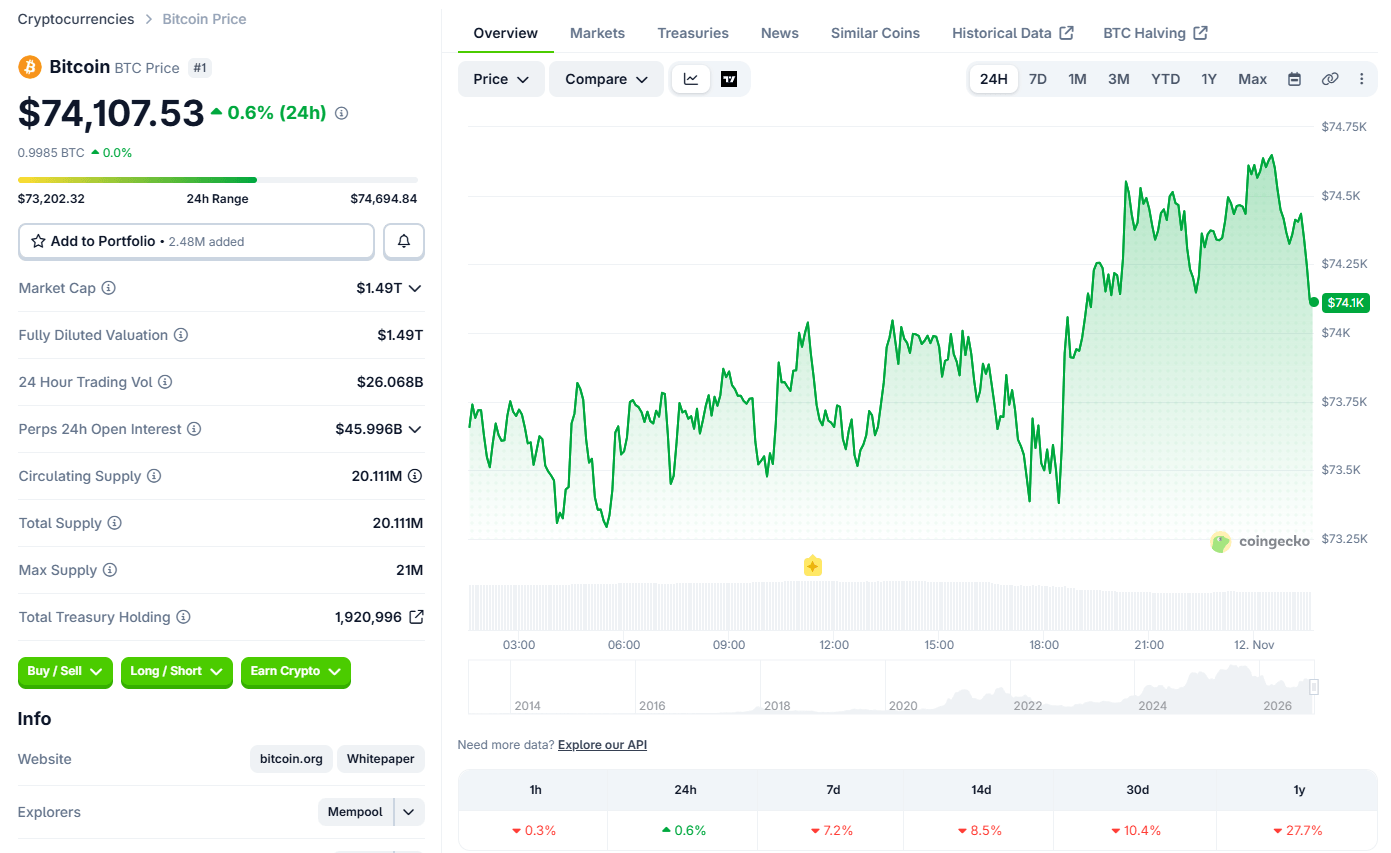
Source: Coingecko
Bitcoin Annual Losses Would Break an 18-Year Pattern
Historical data shows every negative calendar year for Bitcoin has been followed by a positive one. Even the 2018 and 2022 bear markets did not produce consecutive annual declines.
A finish below $87,500 would end that pattern. The pattern has held since the cryptocurrency launched, which makes the current setup unusual.
At the November 11 price, Bitcoin needs a gain of about 17.6% to finish 2026 in positive territory. That level matches the annual opening price near $87,500.
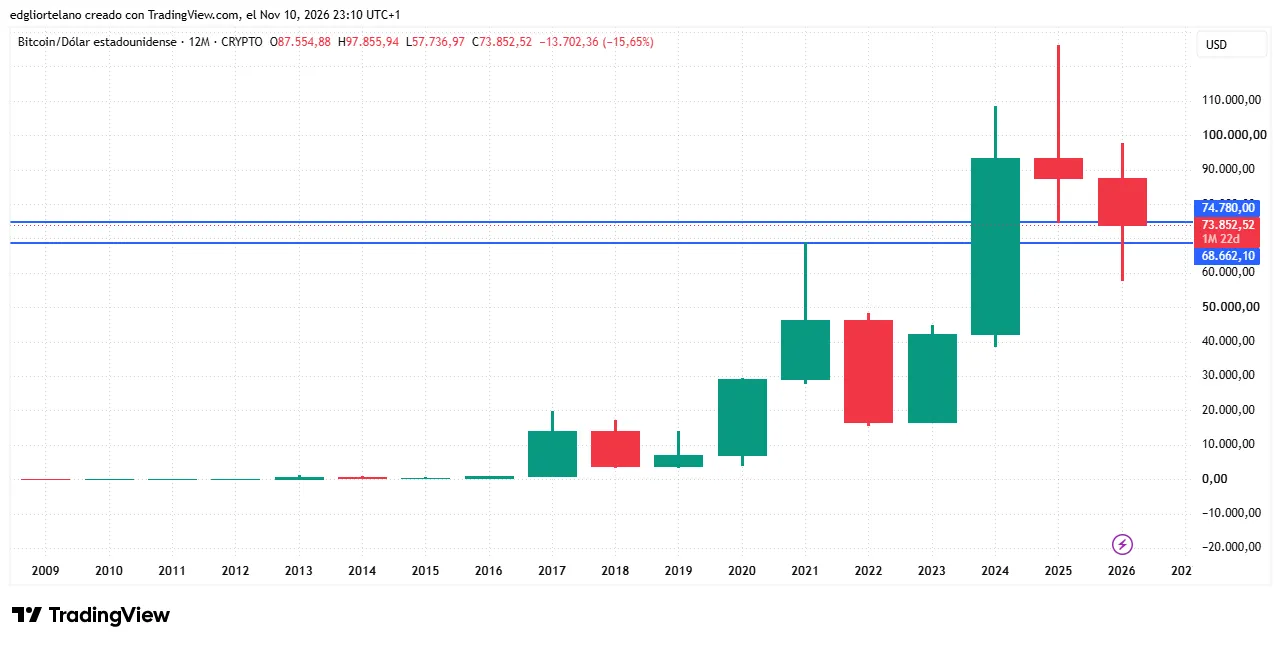
Bitcoin opened 2026 near that price after the 2025 decline. If the price falls short, the two-year streak becomes official on December 31. In that case, Bitcoin annual losses would stretch across 2025 and 2026.
A third consecutive decline in 2027 would extend the streak further. However, that scenario remains hypothetical at this stage.
The streak would start from 2025, when Bitcoin ended the year 6.34% lower. Such a streak would be new in Bitcoin’s trading record.
Two Red Years Look Mild Beside Past Crashes
The combined decline from Bitcoin annual losses in 2025 and 2026 comes to roughly 21% after compounding. By comparison, Bitcoin plunged 73.56% in 2018.
It fell another 64.27% in 2022. Those crashes erased most of investors’ holdings in each year. Both crashes were far steeper than any decline in the current streak.
Bitcoin’s 2024 performance adds context. The cryptocurrency surged more than 120% that year. As a result, investors who bought at the start of 2024 would still hold substantial gains. That holds true despite the decline since then. The 21% combined loss remains smaller than either crash year.
Past rebounds also followed deep losses. Bitcoin gained roughly 92% in 2019 after the 2018 collapse. It then rose more than 155% in 2023 following the 2022 downturn. Each rebound arrived in the year right after the crash. Thus, a bad year has not led to a prolonged downturn so far.
Peak-to-Trough Drop Paints a Deeper Picture
The picture changes when losses are measured from the market peak. Bitcoin reached about $126,000 in October 2025. It then fell below $58,000 during 2026.
That move represents a decline of more than 50%. TradingView price data illustrates the gap between the peak and the lows.
The figure is far larger than the 21% combined loss in the two annual candles. The two annual candlesticks capture only the movement between each January and December.
Streak length and loss severity also differ. A market can decline slowly across several years without one catastrophic year.
Analysts cite institutional investors, spot exchange-traded funds, and deeper liquidity. These factors may explain the smaller bear-market drawdowns.
However, they have not removed major price crashes. As a result, Bitcoin’s current cycle looks different from earlier ones.