



TLDR
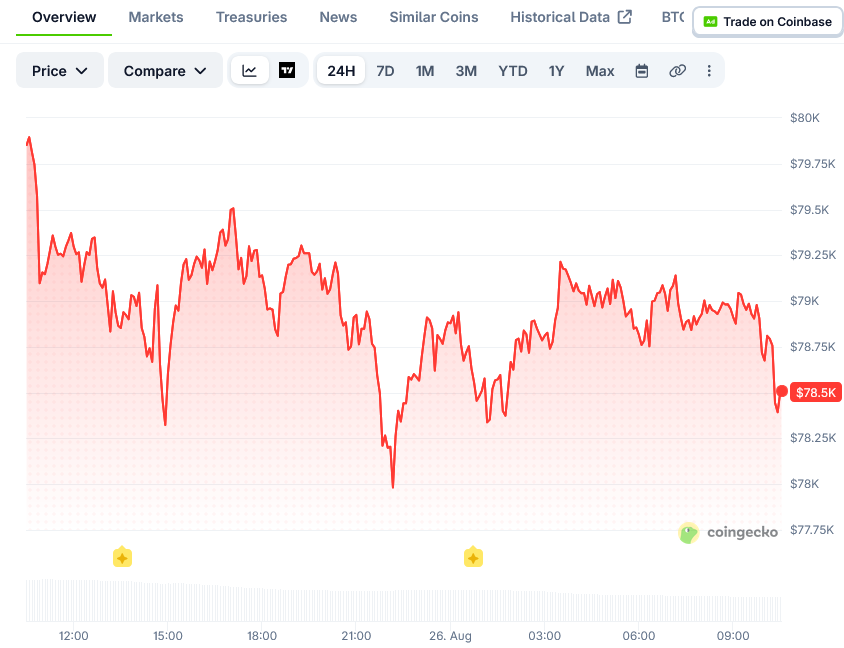
- Bitcoin trades near $78,900, just below the $80,000 mark after a sharp rally.
- U.S. spot Bitcoin ETFs saw $336 million in net inflows on August 25, with $2.08 billion over the past seven days.
- Open interest in Bitcoin derivatives has climbed toward $58 billion.
- The RSI sits above 80, a level that often signals overbought conditions.
- Traders are watching $77,573 and $76,227 as key support levels if a pullback happens.
Bitcoin is trading close to $78,900, sitting just under the $80,000 level after a sharp rally from the mid-$60,000s. Price has held above its 20-, 50-, 100-, and 200-day exponential moving averages since the breakout began.
The move has drawn attention from technical traders and institutional watchers alike. Both groups are tracking flow data closely as price nears the psychological $80,000 line.
On-chain tracker Lookonchain reported that U.S. spot Bitcoin ETFs saw a net inflow of 4,284 BTC, worth about $336 million, on August 25. The same tracker noted that inflows over the past seven days reached 26,499 BTC, equal to roughly $2.08 billion.
Lookonchain’s data broke the flows down by issuer. BlackRock’s IBIT led with 2,650 BTC in daily inflows, while Fidelity’s FBTC added another 1,327 BTC on top of that.
The steady inflow numbers suggest institutional buyers kept adding positions even as Bitcoin trades near its highest levels of the year. Open interest in Bitcoin derivatives has also grown, climbing toward $58 billion according to CoinGlass data.
Momentum Indicators Point to Overextension
Rising open interest alongside a rising price often points to new capital entering the market rather than traders closing existing positions. That pattern has held through this week’s rally.
Bitcoin’s Relative Strength Index sits at 80.45, a level that has historically come before a pause or pullback. The MACD histogram has flattened near zero, showing that buying momentum has stalled.
Price is pressed against the upper Bollinger Band, with a %B reading of 0.88. That band sits at $81,979, while its underlying moving average is still down near $68,978.
The Average True Range stands at $2,532, showing daily price swings remain large. Today’s session high of $80,819 was followed by a 2.1% pullback within the same day.
Where Support and Resistance Sit
The pivot point for Bitcoin sits at $79,196, a level price dipped below during the session. Immediate support is marked at $77,573, with a stronger support shelf sitting at $76,227.
On the upside, $80,542 has acted as a resistance line in recent trading. A close above that level, followed by a push through $82,165, would open the door toward $85,000 to $87,000.
Funding rates for Bitcoin futures remain close to neutral at 0.0077%, showing no crowded long trade. The taker buy/sell ratio slipped just under 1.0, at 0.9954, pointing to a slowdown in aggressive spot buying.
Data on large trader positioning shows a net long bias of 1.05, meaning bigger accounts have not turned bearish. Open interest rose 1.16% over 24 hours, a modest gain rather than a rush of new bets.
The breakout zone near $68,743 has turned into a potential support area on longer time frames. Bitcoin has held above this zone since the rally began.
As of the latest data, Bitcoin continues to trade near $78,744, with traders watching whether ETF inflows and derivatives activity can push price through $80,000. CoinGlass and Lookonchain figures remain the most recent numbers tracked for the current session.

