




TLDR:
- BTC trades near $73.9K, down 5% in seven days, with $72.3K emerging now as a key technical support level.
- Andreou’s first setup targets $98,067 after a reclaim of $72,300, at a projected 5.1:1 risk-reward ratio.
- Failure at $72.3K could expose $69K; Andreou then watches a 62.8K-67.3K buying zone for a second entry.
- U.S. spot Bitcoin ETFs posted $95M in outflows on Nov. 10, extending the net outflow streak to four days.
Bitcoin is trading near $73,900 after falling from $82,172, leaving traders focused on support around $72,300.
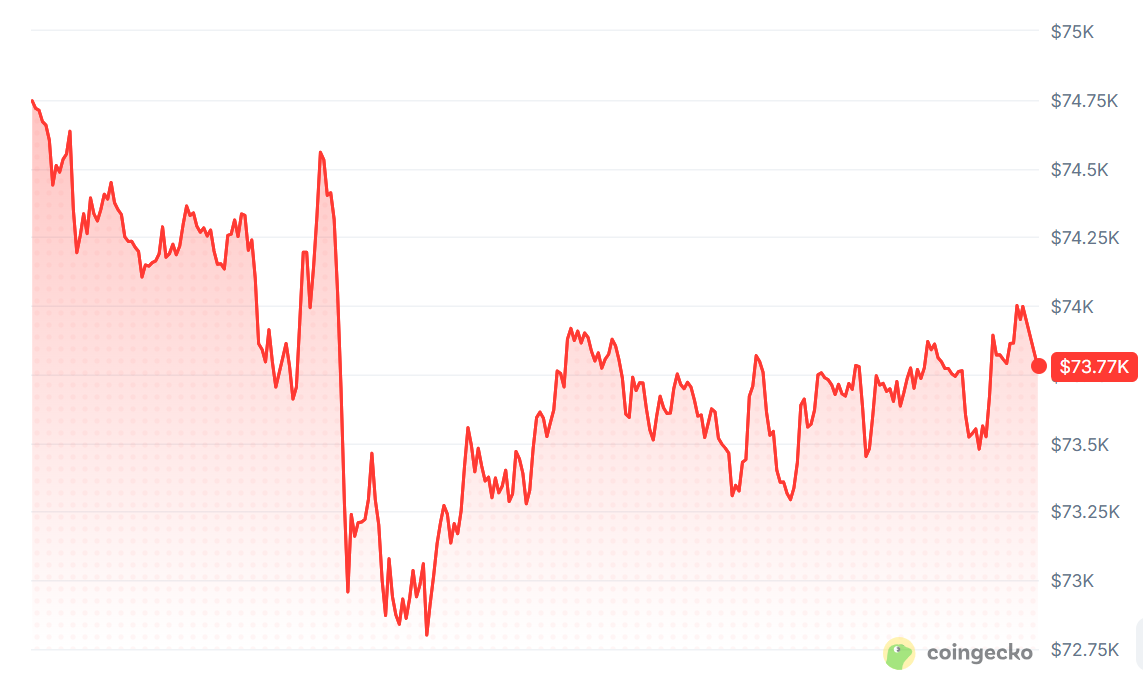
CoinGecko data puts BTC at $73,908.71, down 1.08% over 24 hours and 5% across seven days. The decline has also coincided with sustained withdrawals from U.S. spot Bitcoin exchange-traded funds.
SoSoValue recorded $95.0012 million in Bitcoin ETF net outflows on November 10, extending the streak to four consecutive days. Against that backdrop, market analyst Giannis Andreou has outlined two conditional routes toward the $98,000 area.
Bitcoin Price Holds Near a Key Fibonacci Support
Andreou’s daily chart places Bitcoin near the 0.618 Fibonacci retracement at $72,272.
The level also sits close to the lower boundary of a rising price channel. That makes the area important for traders watching whether buyers can defend the broader structure.
In Andreou’s first scenario, BTC briefly moves below $72,300 before reclaiming the level.
A sweep occurs when price dips below support, triggers stop-loss orders, then reclaims the level. He identifies a potential long entry near $72,355, with a stop-loss at $67,314 and a target of $98,067. The setup offers a projected risk-reward ratio of roughly 5.1 to 1.
A recovery would first need to clear $75,200, according to Andreou’s analysis. The previous swing high near $87,600 would then become another level to watch. These are conditional technical levels, not confirmation that Bitcoin has started a sustained recovery.
The alternative scenario begins if $72,300 breaks and becomes resistance.
Andreou then watches $69,000, followed by a broader buying zone between $62,800 and $67,300. If buyers defend that zone, his second setup identifies an entry near $65,030.
That trade places its stop at $60,540 and its target at $97,979. Andreou estimates a risk-reward ratio of approximately 7.3 to 1. Both scenarios therefore point toward similar upside, but depend on buyers defending different support areas.
Bitcoin ETF Outflows Add Pressure to the Market
Shorter-term trading data shows how sharply Bitcoin has pulled back.
CoinAnk’s two-hour Hyperliquid chart recorded BTC at $73,967, down 1.11%, with a 24-hour range of $72,668 to $74,979. The chart also showed $3.62 billion in volume, $108.70 million in liquidations, and $3 billion in open interest.
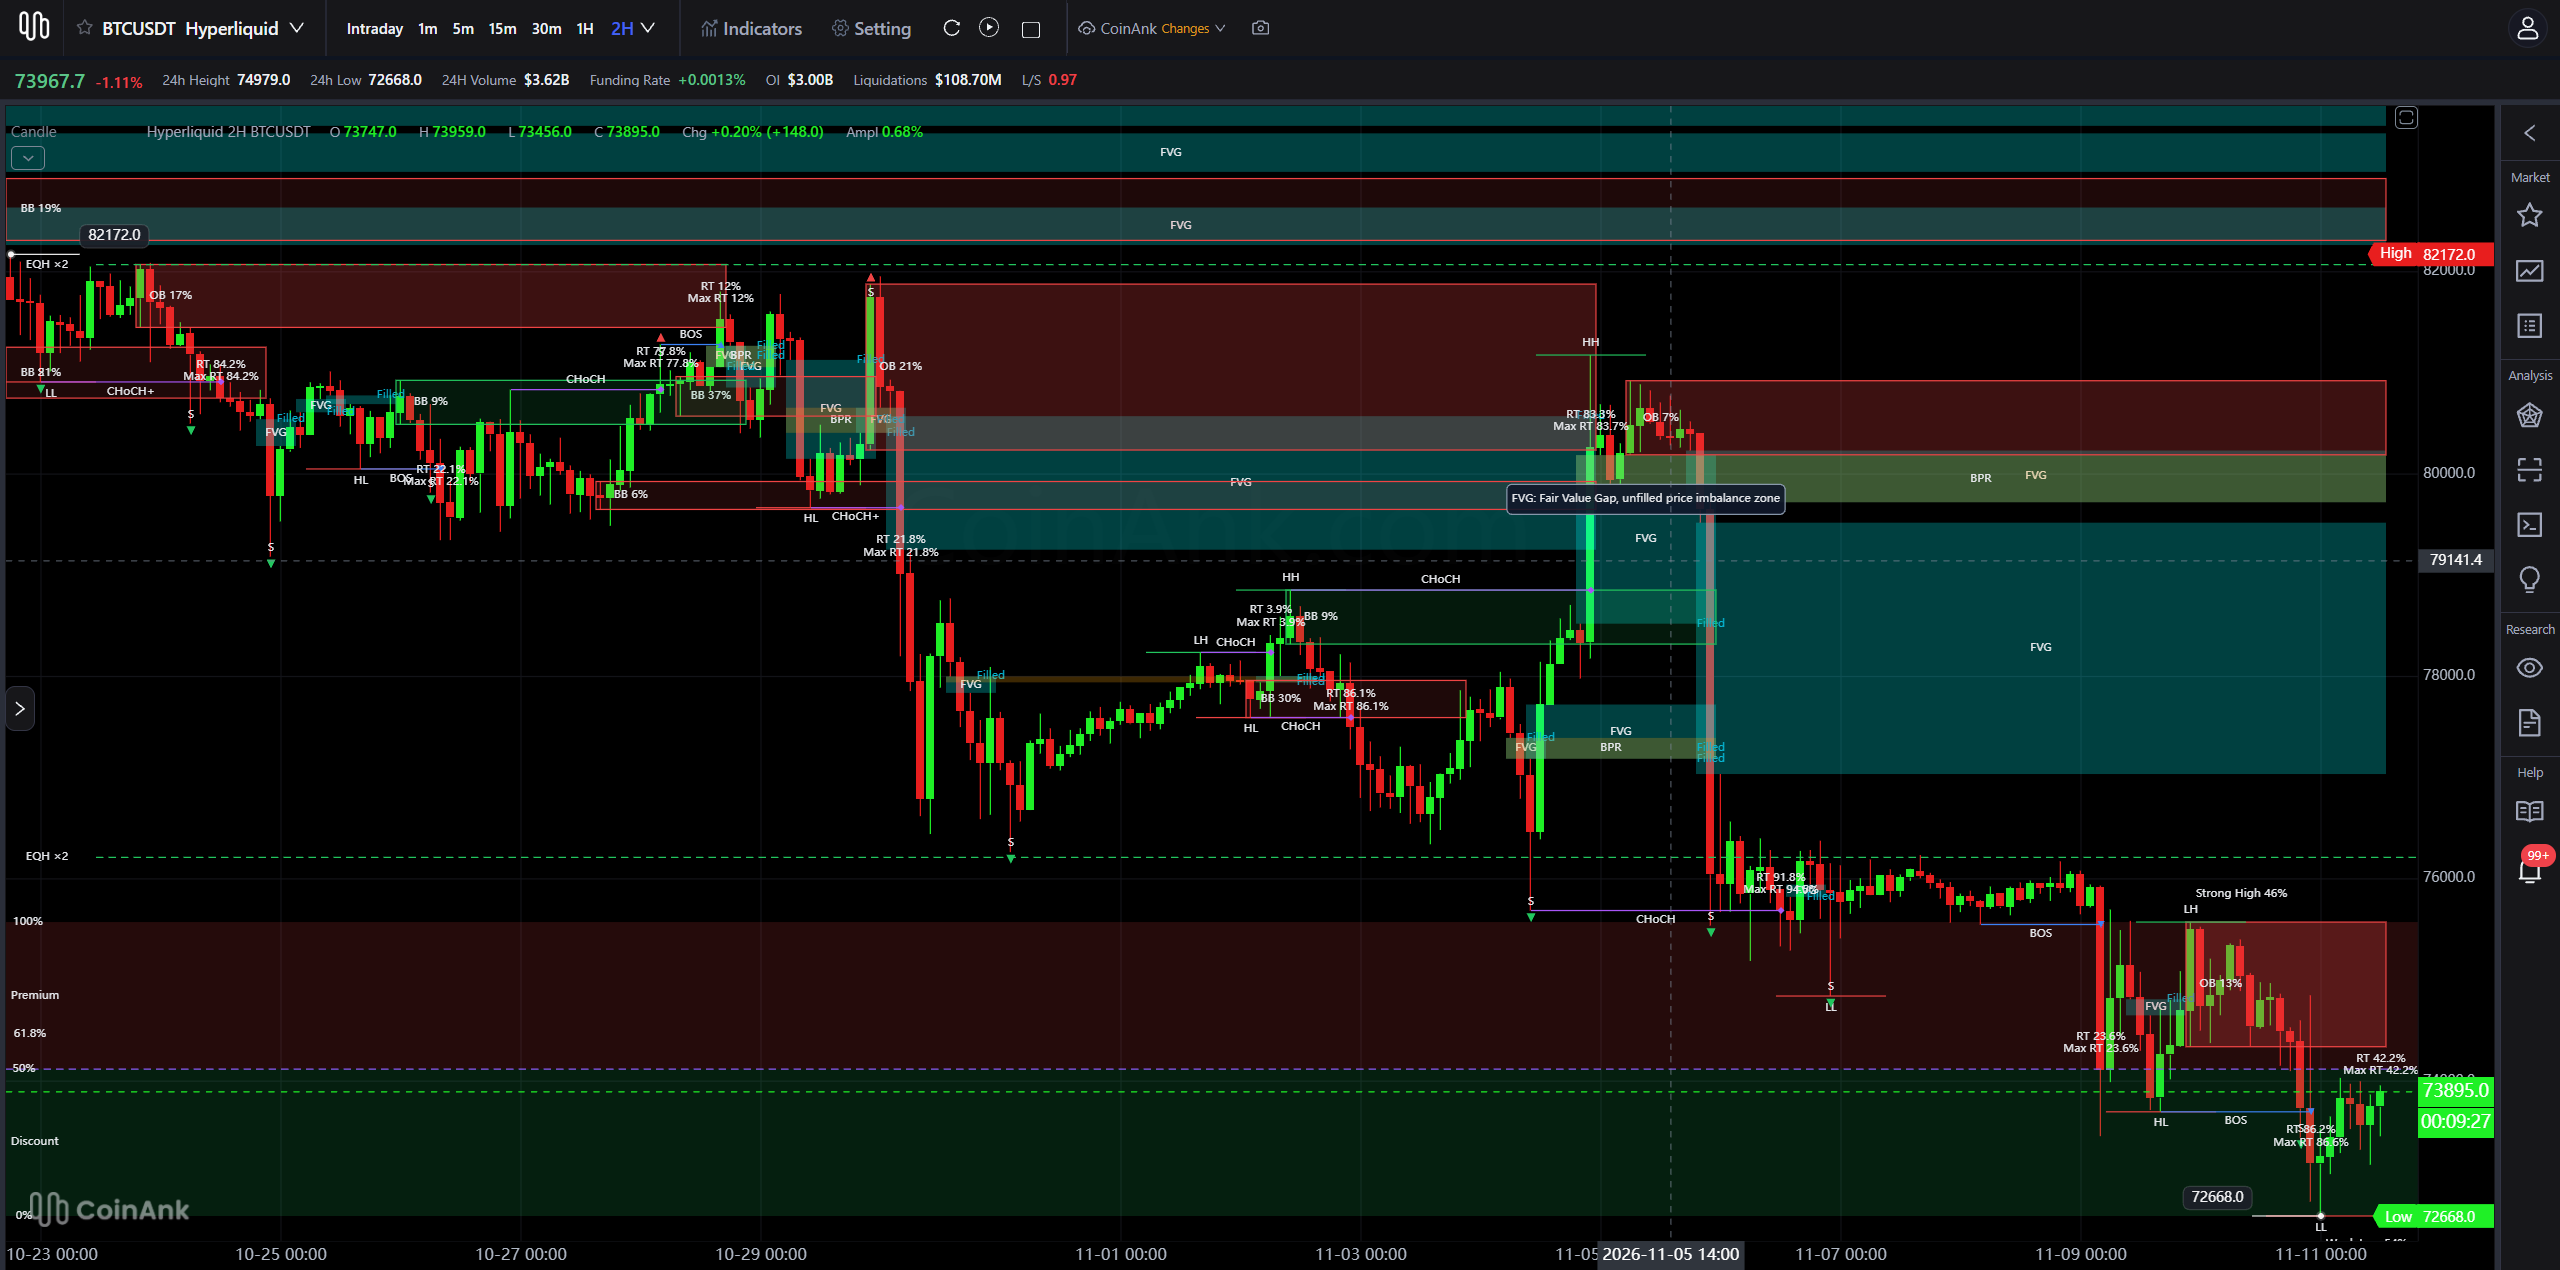
CoinAnk’s chart also showed multiple fair value gaps and order blocks left by the sell-off. Traders often monitor these zones for possible price reactions. The long-short ratio stood at 0.97, while funding remained positive at 0.0013%.
ETF flows provide another measure of demand from traditional investment channels.
SoSoValue reported that U.S. spot Bitcoin ETFs lost $95.0012 million on November 10. That marked four straight sessions of net outflows. Spot Ethereum ETFs lost $1.3168 million, extending their outflow streak to four days.
ETF outflows do not determine Bitcoin’s next move, but they confirm that net withdrawals have continued. Traders face a clear test: Bitcoin must defend $72,300 or risk extending its decline toward lower support.
A move toward $98,000 remains Andreou’s conditional target, not the market’s confirmed direction.