


Crypto lending has grown back into a credit market worth tens of billions of dollars. It rebuilt after Celsius, BlockFi, Genesis and other large lenders failed during the 2022 crypto crisis.
The industry looks different in 2026. Decentralized protocols such as Aave, Morpho and Spark now compete with centralized lenders such as Coinbase, Galaxy, Ledn and Nexo.
This article uses data from Galaxy Research and DefiLlama. It covers market size, loan balances, protocol rankings, interest rates and the main risks.
Crypto Lending Statistics at a Glance
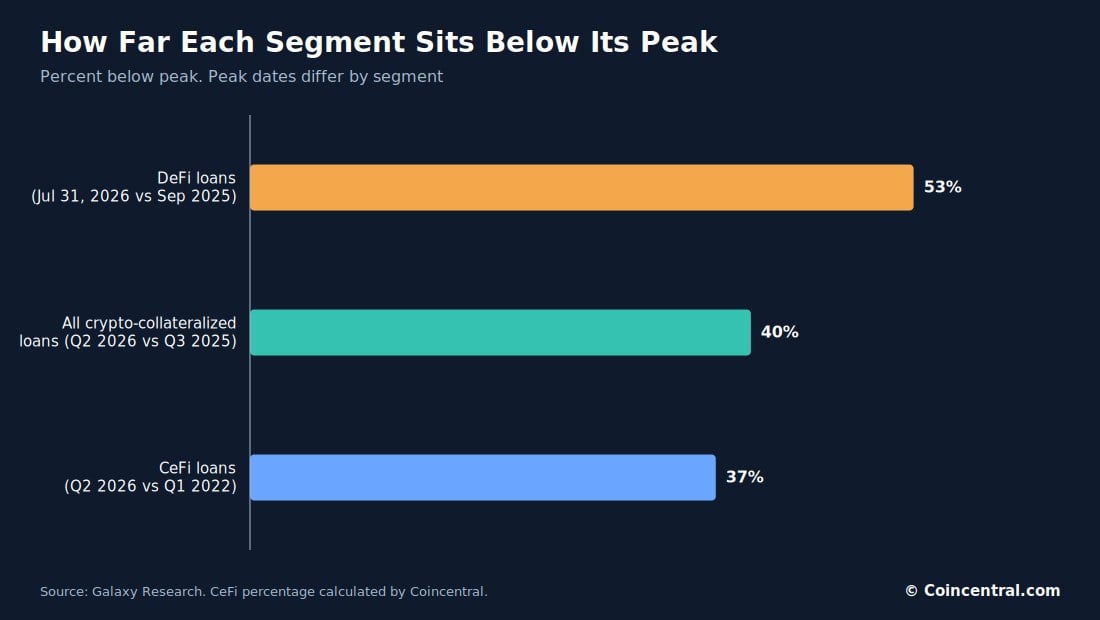
Galaxy Research put the crypto-collateralized lending market at $56.16 billion at the end of Q2 2026. That was down 16.8% from the quarter before and about 40% below the Q3 2025 record of $78.7 billion.
| Metric | Figure |
|---|---|
| Total market, end of Q2 2026 | $56.16 billion |
| Q3 2025 peak | $78.7 billion |
| Change in Q2 2026 | Down 16.8% |
| CeFi loans outstanding | $22.98 billion |
| DeFi loans outstanding (Galaxy) | $20.43 billion |
| DeFi change in Q2 2026 | Down 27.6% |
| CeFi change in Q2 2026 | Down 9.6% |
| Lending protocol TVL (DefiLlama) | $51.6 billion |
| Aave V3 active loans | $11.8 billion |
| Morpho active loans | $5.6 billion |
| Average stablecoin borrow rate | 4.7% |
| Average stablecoin supply rate | 3.6% |
| Debt tied to treasury strategies | More than $17.5 billion |
Sources: Galaxy Research and DefiLlama.
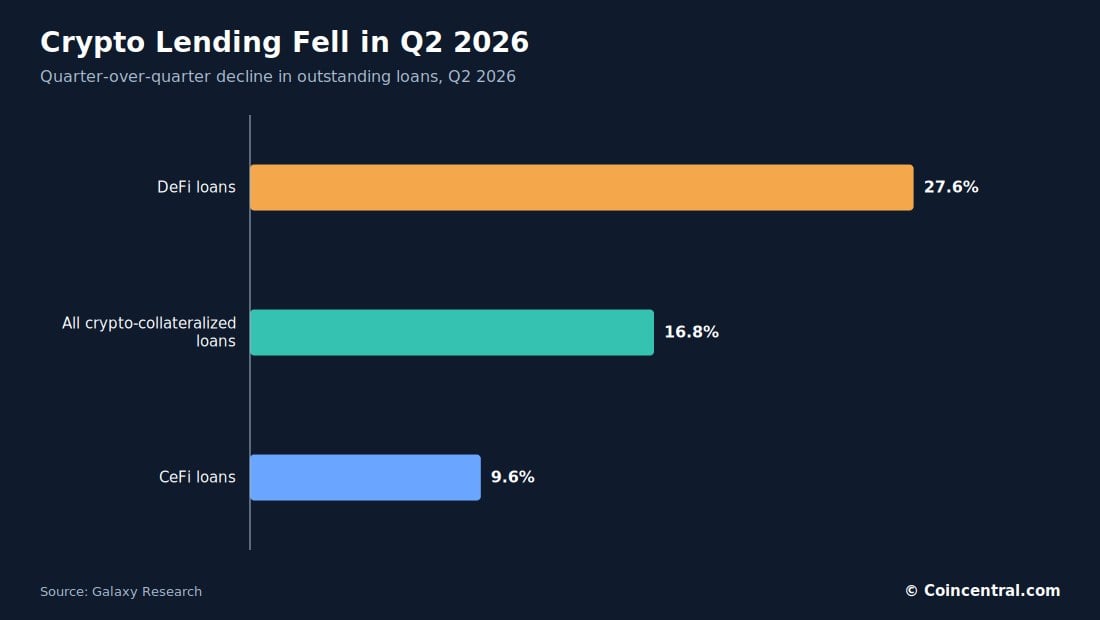
DeFi lending fell the most in the second quarter. CeFi fell by less.
For the first time since Q3 2023, centralized lenders had more outstanding loans than DeFi lending applications.
How Big Is the Crypto Lending Market?
Galaxy’s figure combines several kinds of crypto-backed credit. At the end of Q2 2026, total loans stood at $56.16 billion. That was $11.33 billion lower than three months earlier.
The market was $67.42 billion at the end of Q1 2026. Its record was $78.7 billion in Q3 2025, which puts Q2 2026 about 40% below the peak.
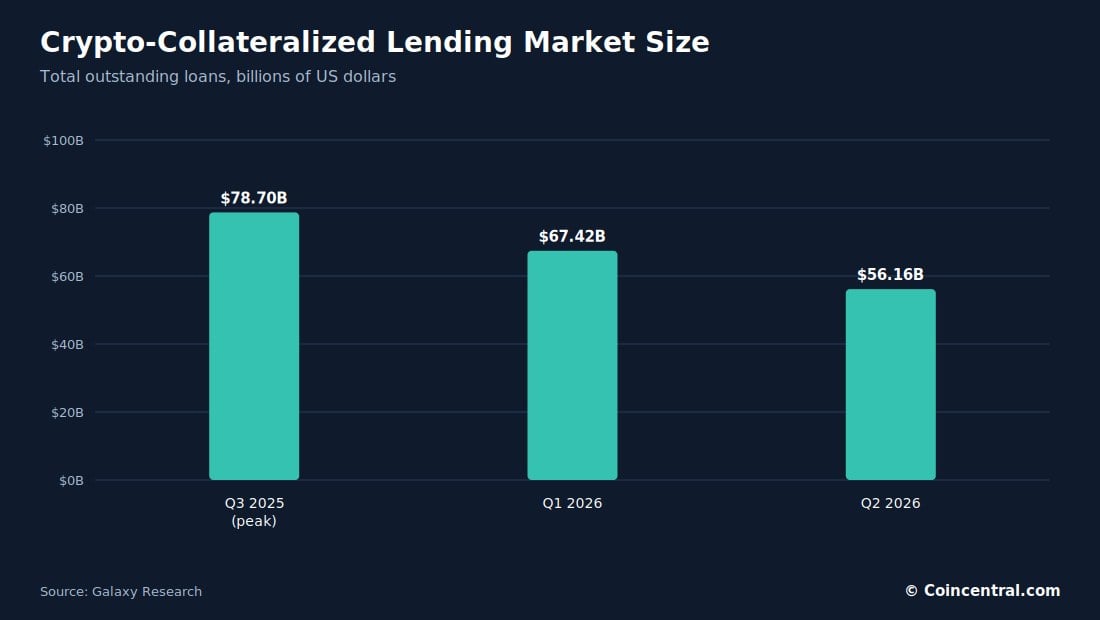
Galaxy described the drop as stepwise deleveraging rather than a cascading collapse. Borrowers have cut leverage over several quarters instead of in one event.
That differs from 2022. DeFi borrowing fell by more than 80% then, and several large centralized lenders failed.
The total also includes more than CeFi and DeFi loans. Subtracting both from the $56.16 billion leaves about $12.75 billion. The research says the rest comes largely from crypto-backed stablecoin debt structures.
CeFi vs DeFi Lending
Crypto lending falls into two groups. In centralized finance, or CeFi, a borrower deals with a company such as an exchange or an institutional lender. Examples include Coinbase, Galaxy, Ledn, Nexo, Arch, Sygnum and Milo.
In decentralized finance, or DeFi, borrowing happens through smart contracts. Examples include Aave, Morpho, Spark, Compound and Euler.
The economics can look alike, but the structure is different. DeFi users deposit collateral into smart contracts, and anyone can check liquidity and debt on-chain. Centralized lenders hold collateral internally and usually share less real-time data.
| Feature | CeFi | DeFi |
|---|---|---|
| Who holds collateral | The lender | Smart contracts |
| Data visibility | Limited real-time data | Debt and liquidity visible on-chain |
| Loans, end of Q2 2026 | $22.98 billion | $20.43 billion |
| Change in Q2 2026 | Down 9.6% | Down 27.6% |
Source: Galaxy Research.
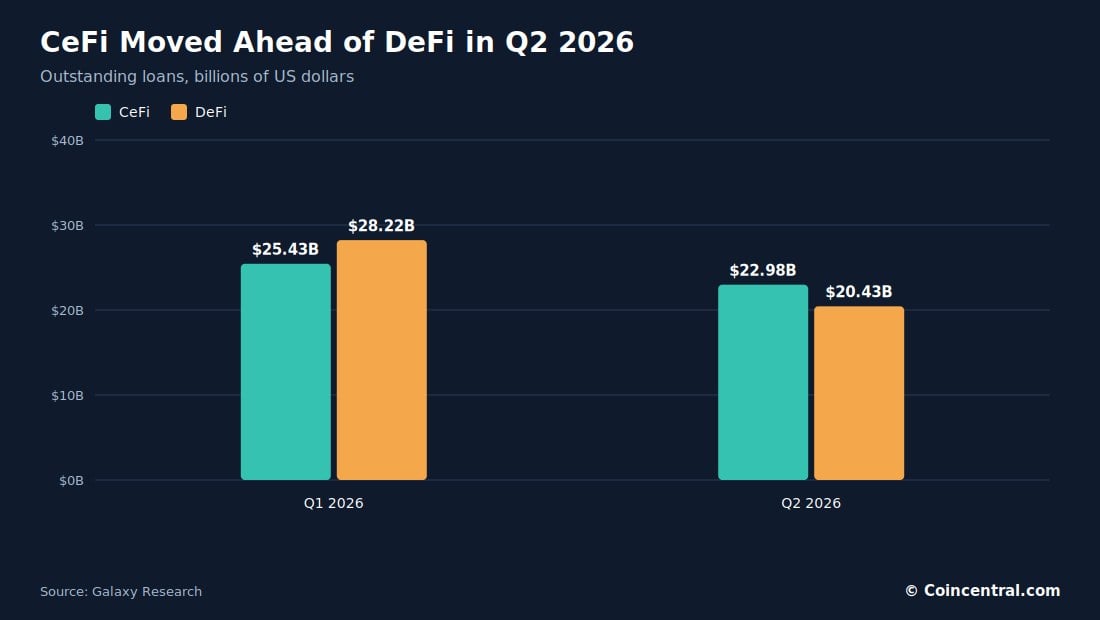
In Q1 2026, DeFi had $28.22 billion in loans against $25.43 billion for CeFi. By the end of Q2, CeFi led with $22.98 billion to $20.43 billion.
This is not a return to the pre-Celsius model. Today’s large centralized lenders generally stress overcollateralization, institutional clients, better custody, clear balance sheets, shorter loan terms and regulated structures.
Centralized Crypto Loans: About $23 Billion Outstanding
Galaxy estimated CeFi loans at $22.98 billion at the end of Q2 2026. That was down 9.6% from $25.43 billion in Q1. The Q1 figure was already about 30% below the sector’s Q1 2022 record of $36.58 billion.
The low point came in Q4 2023. CeFi loans fell to about $6.8 billion after Celsius, BlockFi, Genesis and other lenders failed. By Q1 2026, the market was more than 270% above that low.
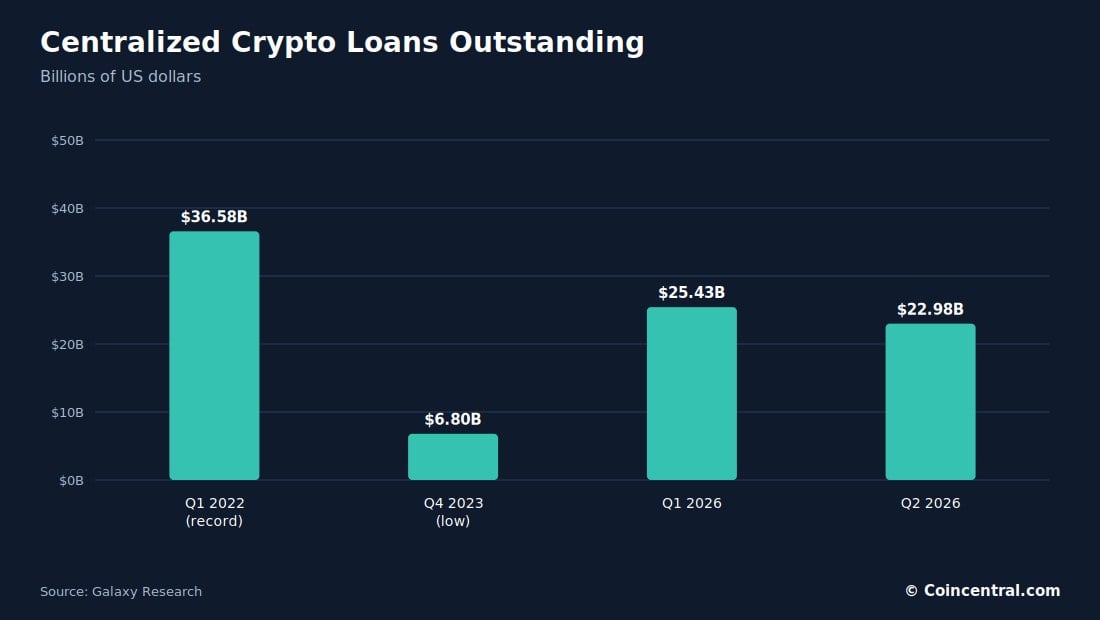
The modern CeFi market leans toward institutional and collateralized lending. It relies less on unsecured retail yield products.
Galaxy’s own loan book shows the shift. Its average loan book was about $1.44 billion in Q2 2026, up slightly from $1.43 billion in Q1. New loans originated rose during the quarter.
Coinbase, Ledn, Arch, Sygnum and Milo also reportedly grew their loan books while the overall market shrank. This suggests lending is moving toward larger, better-capitalized providers.
DeFi Lending Fell More Sharply
Galaxy put outstanding DeFi loans at $20.43 billion at the end of Q2 2026. That was down 27.6% from $28.22 billion at the end of Q1.
The all-time high was about $47.13 billion in September 2025. By July 31, 2026, Galaxy estimated on-chain lending at $21.94 billion, or 53% below the peak.
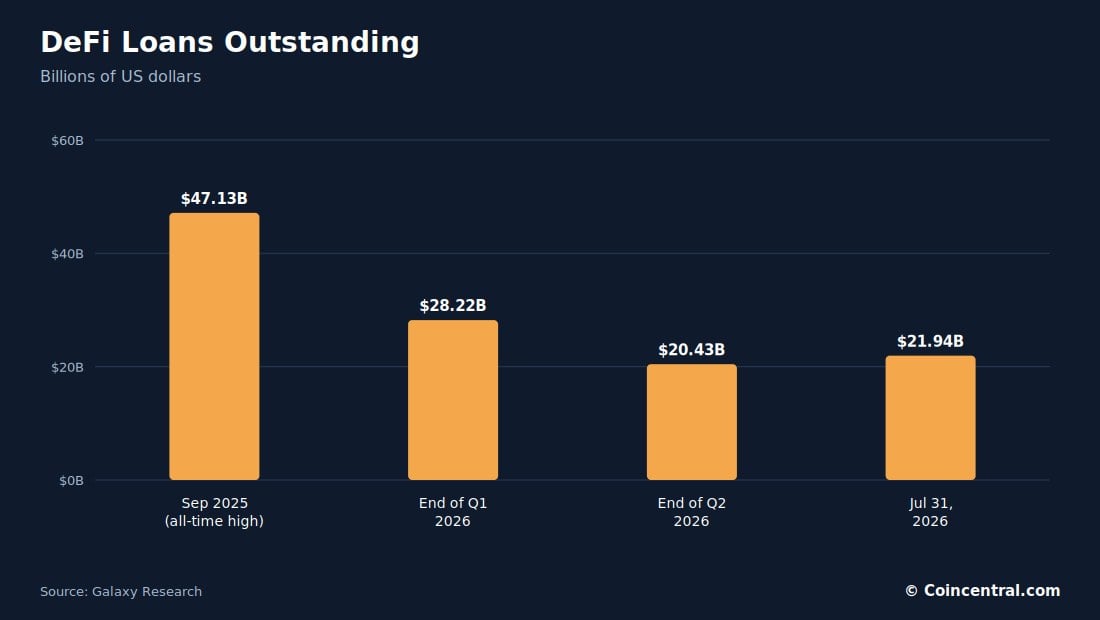
The July figure is slightly higher than the end-of-June level. The drop from the peak is still large.
It is smaller than the decline of more than 80% in the previous bear market.
Lenders and borrowers can also move between protocols quickly. That helps explain why on-chain balances can change within weeks.
Why TVL Is Not the Same as Lending
A common mistake in crypto lending statistics is treating total value locked, or TVL, as outstanding loans. The two measure different things.
DefiLlama tracks about $51.6 billion of TVL across roughly 515 lending protocols. Much of that is collateral or supplied funds that nobody has borrowed.
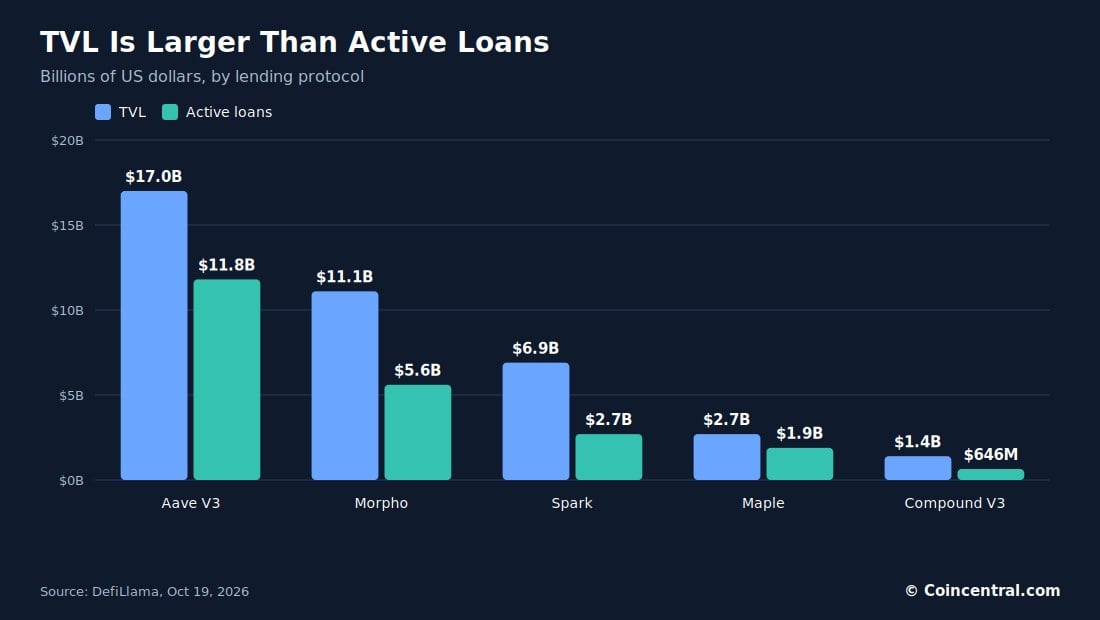
Aave V3 has about $17 billion of TVL but $11.8 billion in active loans. Morpho has about $11.1 billion of TVL and $5.6 billion in loans.
Using $51 billion as the size of DeFi borrowing would overstate actual debt. The table below shows how much of each protocol’s TVL is currently lent out.
| Protocol | TVL | Active loans | Loans as share of TVL |
|---|---|---|---|
| Aave V3 | $17.0 billion | $11.8 billion | 69% |
| Morpho | $11.1 billion | $5.6 billion | 50% |
| Spark | $6.9 billion | $2.7 billion | 39% |
| Maple | $2.7 billion | $1.89 billion | 70% |
| Compound V3 | $1.4 billion | $646 million | 46% |
Source: DefiLlama, Oct 19, 2026. Share of TVL calculated by Coincentral and rounded.
The share ranges from 39% at Spark to 70% at Maple. A higher share means more of the deposited money is being used for loans. A lower share means more sits idle.
Aave, Morpho, Spark, Maple and Compound
Five protocols account for most of the large on-chain lending books. Each works a little differently.
Aave: the largest DeFi lender
As of October 19, 2026, DefiLlama showed Aave V3 with about $17.0 billion of TVL and $11.8 billion in active loans. Aave V3 runs on more than 20 networks, including Ethereum, Base, Arbitrum, Plasma and Monad.
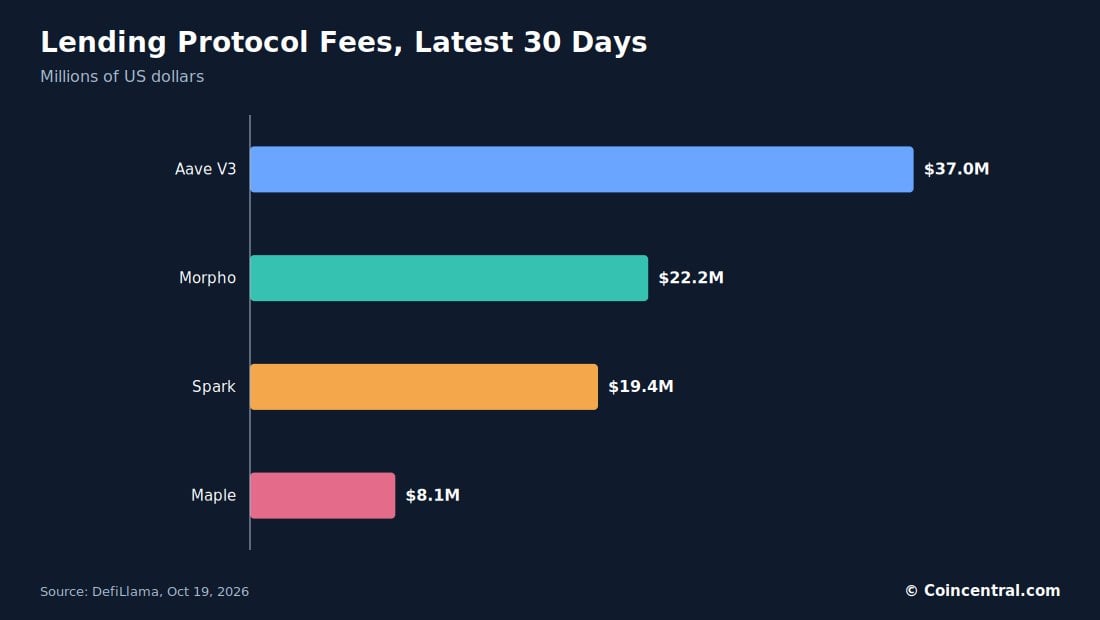
Ethereum holds about 83% of Aave V3 TVL. The protocol generated about $37 million in fees over the latest 30 days, and $4.75 million of that became protocol revenue. DefiLlama’s trailing annualized fee rate is about $677 million.
Aave’s $11.8 billion in loans equals about 58% of Galaxy’s $20.4 billion DeFi total. The two data sets differ in date and method, so treat that as a rough guide.
Morpho: Aave’s closest challenger
Morpho has about $11.1 billion of TVL and $5.6 billion in active loans. It earned about $22.2 million in fees over the latest 30 days. Its TVL equals about 21.5% of all lending TVL tracked by DefiLlama.
Morpho works as an infrastructure layer. Specialized lending markets and curated vaults are built on top of it.
Spark, Maple and Compound
Spark has about $6.9 billion of TVL and $2.7 billion in active loans. Its products include SparkLend, Spark Liquidity Layer and Spark Savings. Ethereum holds close to 90% of its TVL. Spark earned about $19.4 million in fees over 30 days, with annualized fees near $190 million.
Maple focuses on institutional credit and professionally managed lending pools. It has about $2.7 billion of TVL and $1.89 billion in active loans. Its 30-day fees were about $8.1 million, or roughly $110 million on an annual basis.
Compound V3 has about $646 million in active loans and $1.4 billion of TVL. That is well behind Aave, Morpho and Spark. Compound still matters historically, because its early markets helped popularize algorithmic interest rates and permissionless borrowing.
How Crypto Lending Interest Rates Work
Most DeFi borrowing rates are variable. They rise when utilization rises. Utilization is the share of a lending pool that has been borrowed.
Picture a pool with $100 million of USDC. If $30 million is borrowed, cash is plentiful and rates can stay low. If $95 million is borrowed, cash is scarce and rates climb.
Higher rates push borrowers to repay, draw in new lenders and restore liquidity. The market sets the rate, not a bank.
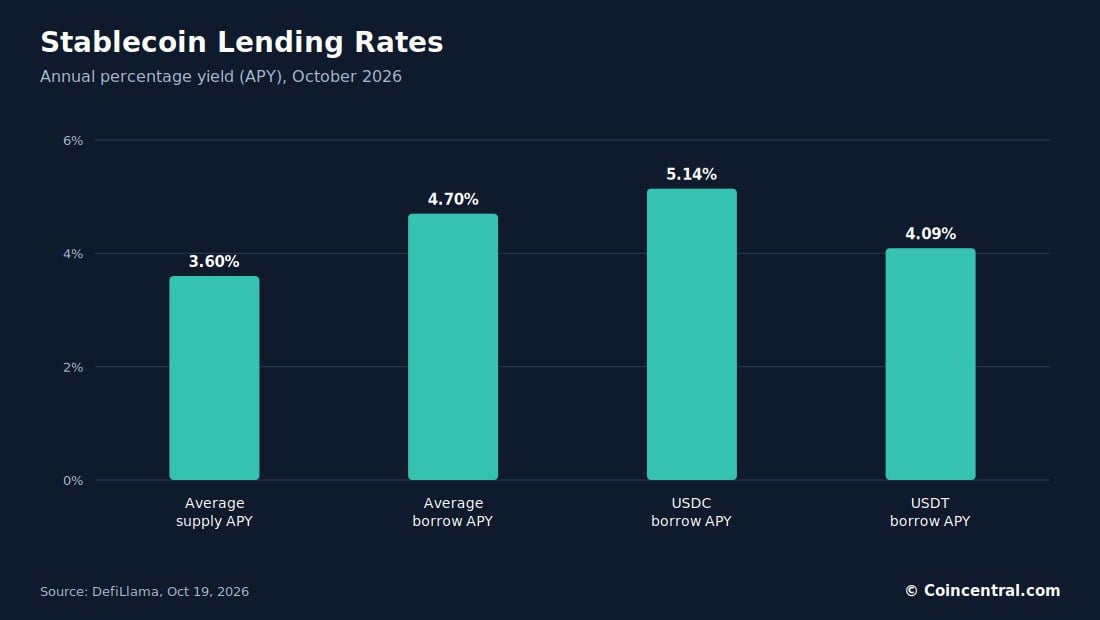
DefiLlama’s market-weighted stablecoin reference rate shows an average supply APY of about 3.6% and an average borrow APY of about 4.7%. That leaves a lending spread of roughly 1.05 percentage points.
USDC borrowing costs about 5.14% and USDT about 4.09%. Rates can change every day as demand and liquidity move.
Borrow Rates by Stablecoin
Borrowing costs differ by stablecoin. USDe is the most expensive of the ten tracked, at about 6.61%. USDtb is the cheapest, at about 3.11%.
| Stablecoin | Approx. borrow APY |
|---|---|
| USDe | 6.61% |
| PYUSD | 5.27% |
| USDC | 5.14% |
| DAI | 4.68% |
| USDS | 4.32% |
| USDG | 4.11% |
| USDT | 4.09% |
| frxUSD | 3.90% |
| RLUSD | 3.85% |
| USDtb | 3.11% |
Source: DefiLlama, Oct 19, 2026.
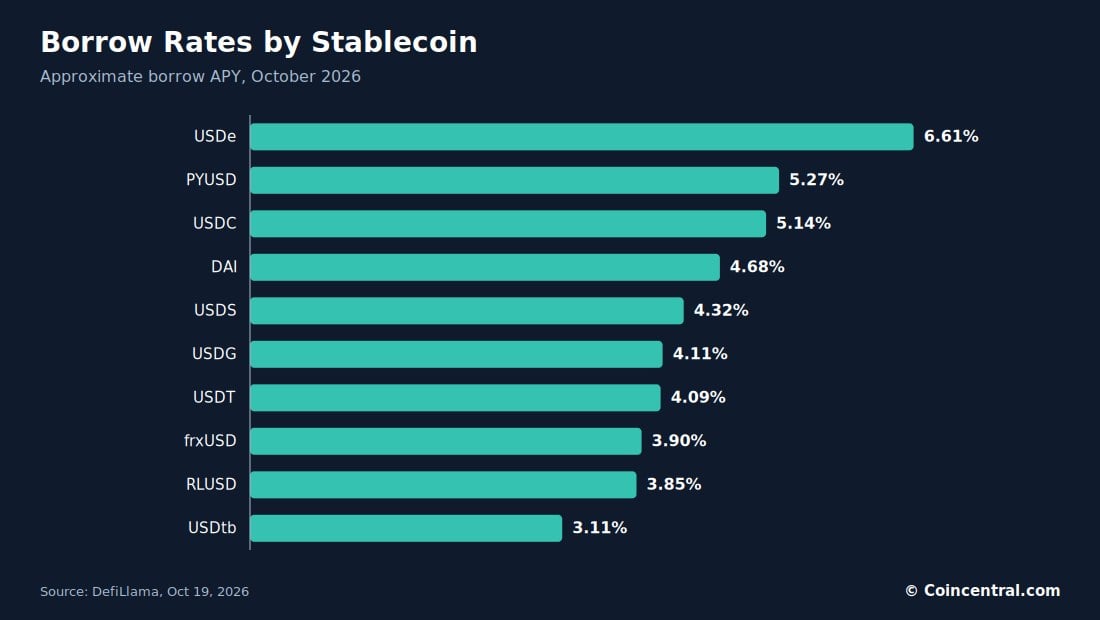
The gap between the highest and lowest rate is about 3.5 percentage points. USDC and USDT, the two largest stablecoins, sit about one point apart.
These are snapshots. They move with borrowing demand and available liquidity.
Supply rates follow the same pattern. Lenders earn less than borrowers pay, and the difference funds the protocol and its reserves.
Borrowing Costs Vary by Protocol
DefiLlama also estimates weighted borrowing rates for each protocol. Fluid is highest at 6.46% and SparkLend is lowest at 4.26%.
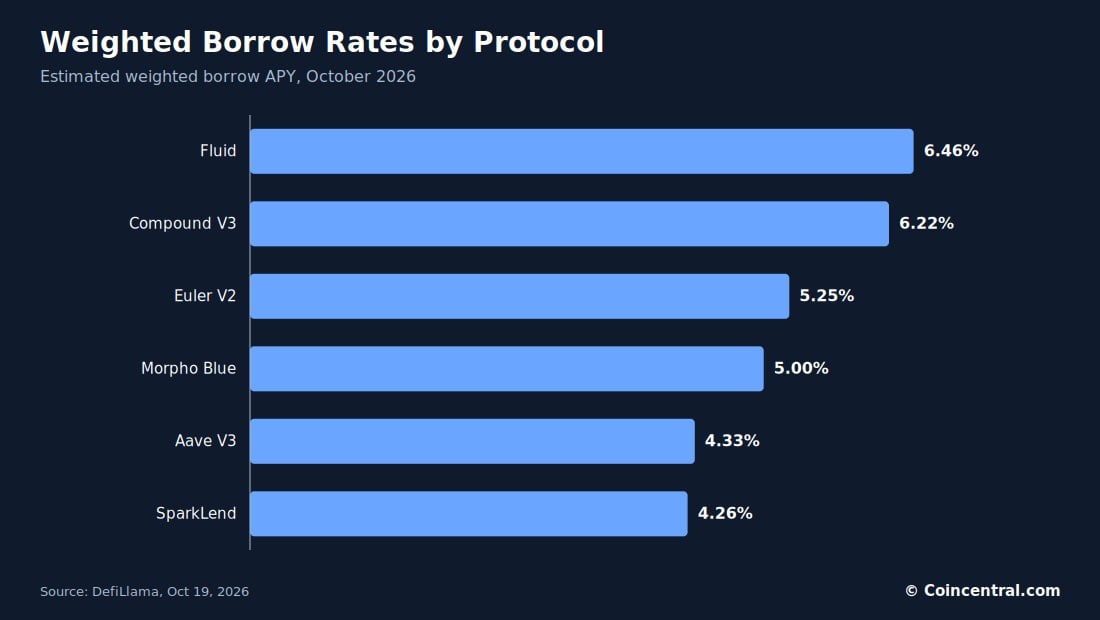
Compound V3 charges about 6.22%, which is nearly two percentage points above Aave V3 at 4.33%. Morpho Blue sits at 5.00% and Euler V2 at 5.25%.
Gaps like these add up on large loans. On $1 million borrowed for a year, a two-point rate difference equals about $20,000 in interest.
These are broad weighted averages, not guaranteed rates. The actual cost depends on several factors.
- The asset borrowed
- The blockchain used
- Utilization of the pool
- The collateral posted
- The loan-to-value ratio
- Incentive rewards
- Market conditions
Why People Borrow Against Crypto
A crypto holder may borrow instead of selling for several reasons.
- Keep the asset. An investor may expect Bitcoin to rise but still need cash. They can pledge BTC as collateral and borrow stablecoins.
- Trading leverage. Borrowed stablecoins can buy more crypto. This raises both possible gains and possible losses.
- Tax planning. In some places, borrowing may not trigger the same tax event as selling. Rules vary, so professional advice is needed.
- Business cash. Companies that hold crypto can get working capital without selling treasury assets.
- Arbitrage trades. Professional traders borrow assets to trade price gaps between spot, futures and derivatives markets.
Overcollateralization is the norm
Most DeFi loans require collateral worth more than the loan. A borrower might deposit $150,000 of ETH to borrow $100,000 of USDC. That is a loan-to-value ratio of 66.7%.
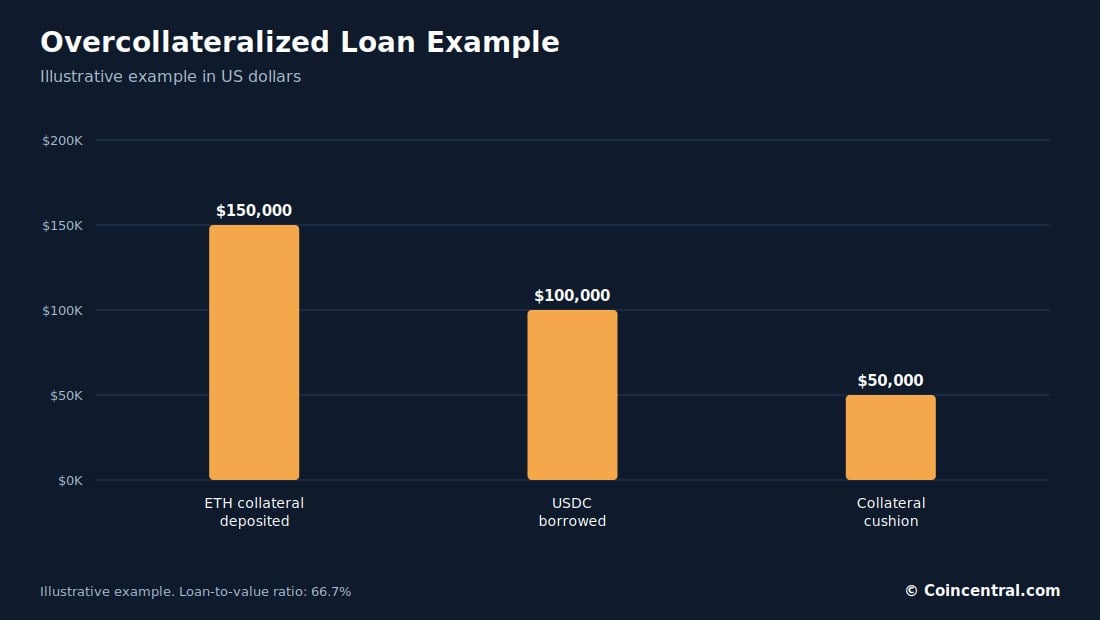
If ETH falls far enough, the collateral can be sold automatically. This protects lenders, but borrowers take on market risk.
It also explains why crypto loans differ from unsecured personal loans. The borrower’s identity matters less because the collateral can be seized by the protocol.
Liquidations and Smart-Contract Risk
When collateral falls below a protocol’s required level, smart contracts let liquidators repay part of the debt and claim the collateral. This protects lenders. It can also deepen market declines.
A chain of liquidations can unfold in steps:
- Crypto prices fall.
- Collateral values drop.
- Some loans become undercollateralized.
- Automated liquidations begin.
- More crypto is sold.
- Prices come under further pressure.
Price swings are not the only risk. Galaxy reported that DeFi lending was disrupted in Q1 2026 by large exploits involving Drift and LayerZero/KelpDAO.
After the LayerZero/KelpDAO incident, Aave saw more than $5.5 billion of stablecoin withdrawals. About $3.1 billion of stablecoin loans were closed within roughly two weeks.
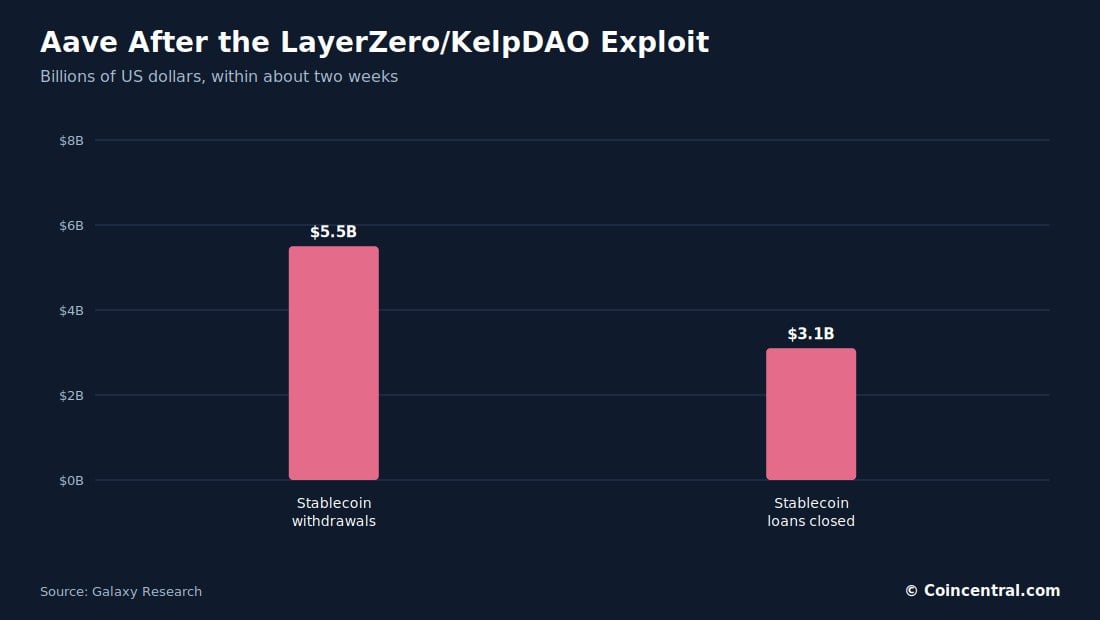
The episode shows that overcollateralized lending can still see fast capital flight when users lose confidence in collateral or security.
New Demand: Vaults and Treasury Companies
Two newer trends are shaping crypto credit. The first is the growth of lending vaults. The Financial Times reported in October 2026 that these vaults had drawn more than $10 billion, up from roughly $4 billion at the start of 2025.
Some vaults offered yields from about 3% to more than 20%. Higher yields generally point to higher credit, liquidity or collateral risk.
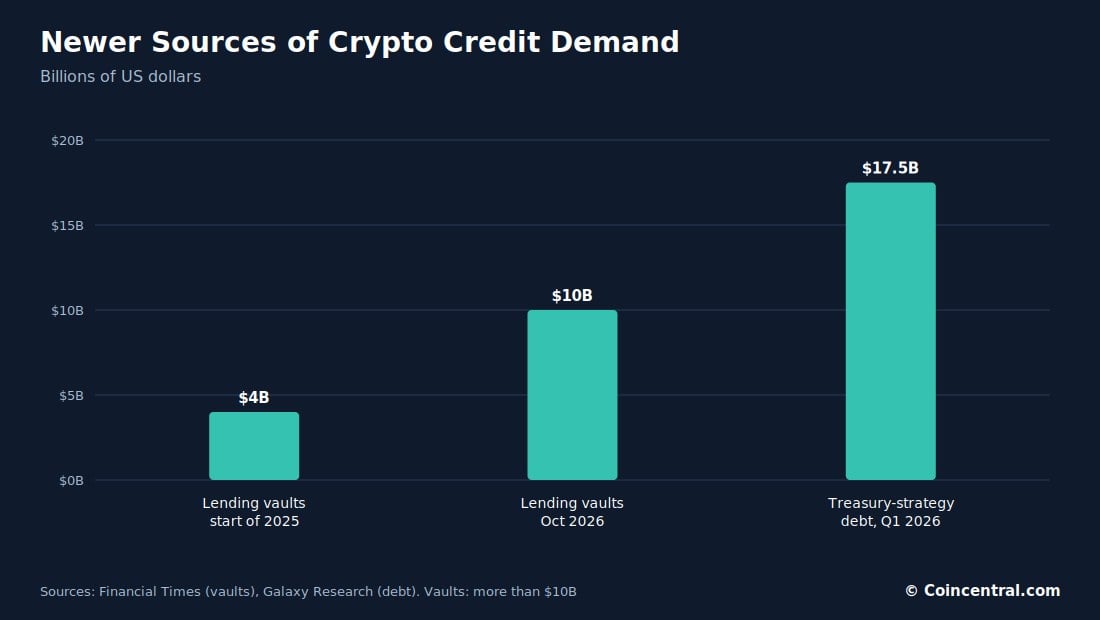
The second trend is corporate leverage. Galaxy estimated that more than $17.5 billion of debt had been used by Q1 2026 to buy digital assets or to support digital-asset treasury strategies.
This links crypto lending to public companies that hold Bitcoin and other tokens. If those strategies spread, loans backed by crypto could become a larger institutional credit market.
The Bottom Line
Galaxy Research valued crypto-collateralized borrowing at about $56.16 billion at the end of Q2 2026. That is roughly 40% below the Q3 2025 peak of $78.7 billion.
Centralized lenders held about $23 billion of loans. DeFi lending applications held about $20.4 billion. The rest came largely from crypto-backed stablecoin debt structures.
Within DeFi, Aave leads with about $11.8 billion of active loans. Morpho follows with $5.6 billion, then Spark with $2.7 billion, Maple with $1.9 billion and Compound V3 with $646 million.
Borrowing is also cheaper than in periods of heavy speculation. The average stablecoin borrow rate is about 4.7%, while lenders earn about 3.6%.
Risks remain. Collateral prices can fall, smart contracts can fail and borrowers can be liquidated automatically.
After the failures of 2022, the sector has rebuilt around overcollateralized loans, open liquidity data and more institutional borrowers. The market is smaller than its 2025 peak, but it is better organized than the one that entered the last downturn.
Sources
- Galaxy Research: The State of Crypto Leverage Q2 2026. Centralized lending, DeFi borrowing and collateralized stablecoin debt.
- Galaxy Research: Crypto Lending Contracts, But Slowly This Time. Outstanding crypto loans and the comparison with 2022.
- Galaxy Research: The State of Crypto Leverage Q1 2026. CeFi loan books, DeFi borrowing and treasury debt.
- DefiLlama: Stablecoin Reference Rates. Market-weighted stablecoin borrow and supply rates.
- DefiLlama: Aave V3. Aave TVL, active loans, fees and revenue.
- Morpho: Network Data. Morpho deposits, outstanding loans and lending activity.
- DefiLlama: Morpho. Morpho TVL, active loans, fees and market share.
- DefiLlama: Spark. Spark TVL, borrowing, fees and protocol data.
- DefiLlama: Maple Finance. Maple institutional lending TVL and active loans.
- DefiLlama: Compound V3. Compound V3 lending, TVL, fees and revenue.
- Coinbase Institutional: Guide to Crypto Markets 2026. Market structure, leverage, lending and trading infrastructure.