



TLDR:
- Solana averaged over 1,400 TPS year-to-date, far exceeding BNB Chain and other blockchain networks.
- Grayscale expects Alpenglow to reduce Solana’s transaction finality from 13 seconds to 150 milliseconds.
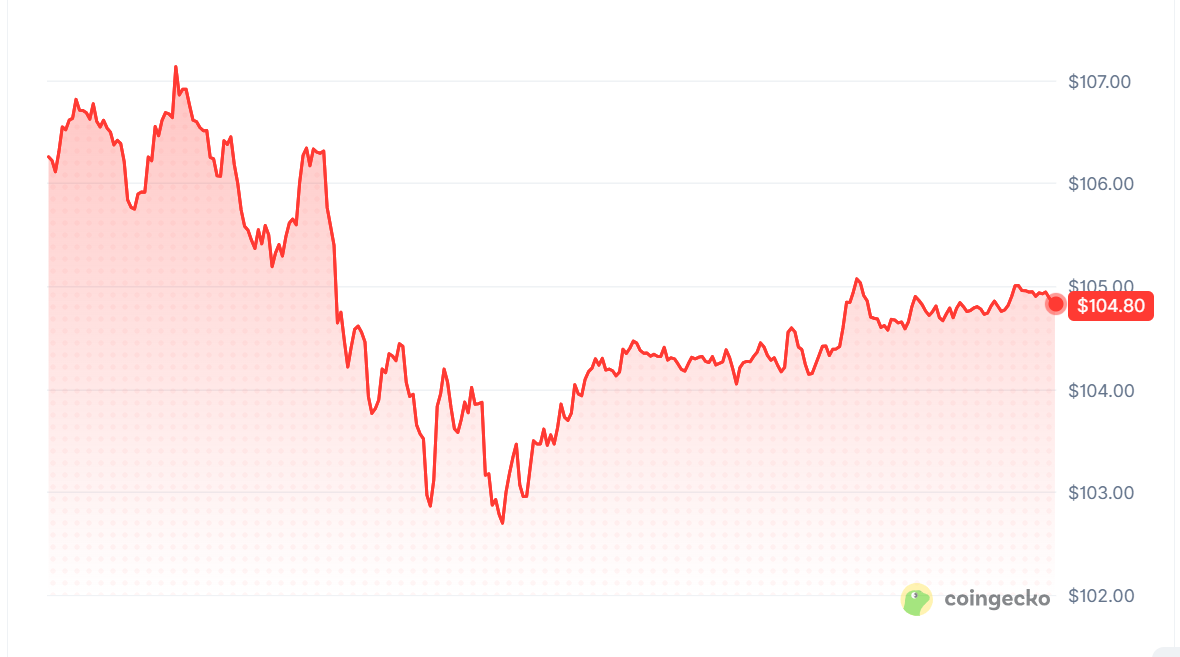
- SOL trades near $105, with analyst Don identifying $80-$95 as the key support zone.
- Don sees $166 and $378 as potential upside targets if SOL reclaims its descending trendline.
Solana is trading near $105 as traders watch a key support zone and an upcoming network upgrade. Grayscale says Solana averaged more than 1,400 transactions per second year-to-date, far exceeding competing blockchain networks.
The firm expects the Alpenglow upgrade next week to reduce transaction finality from roughly 13 seconds to 150 milliseconds. Meanwhile, crypto trader Don identifies 80–95 as a crucial support zone for SOL, with potential upside targets at $166 and $378.
How Could Solana’s Alpenglow Upgrade Change Network Performance?
Solana’s transaction throughput remains a central part of its competitive position.
Grayscale reports that the network averaged more than 1,400 transactions per second year-to-date. BNB Chain averaged fewer than 200 TPS, while other blockchain networks processed approximately 40 TPS.
Transaction throughput measures how many transactions a network processes within a second. Higher throughput can help blockchains handle more activity, although actual performance also depends on network conditions and transaction demand.
Grayscale also highlights Solana’s transaction costs.
Fees have averaged approximately $0.005 this year, making transactions relatively inexpensive for users. The network currently reaches transaction finality in roughly 13 seconds.
Finality indicates when a transaction is considered irreversible under a blockchain’s consensus rules.
The planned Alpenglow upgrade is expected to reduce that period to 150 milliseconds. This would represent a substantial reduction in the time users wait for transaction confirmation.
However, the upgrade’s expected performance gains should remain distinct from Solana’s current capabilities. The 150-millisecond figure is a projected outcome, not the network’s existing finality time.
Grayscale also points to Solana’s activity in stablecoin payments.
Over the past three months, the network processed approximately 25% of all stablecoin transactions. That share exceeded every other blockchain during the period.
Faster finality and low fees could support payment applications that require rapid settlement. They may also help developers build applications where transaction costs and confirmation times influence user experience.
What SOL’s $80-$95 Support Zone Means for Traders
SOL’s technical structure presents a separate question for traders.
Don says the token remains near $105 after facing rejection at a descending trendline. The analyst also notes that SOL has stabilized above $100 without retesting the lower support zone.
According to Don, the $80-$95 region remains the key support area.
A yellow ascending trendline extending from 2023 lows provides additional long-term chart context. Together, these levels define the area traders may monitor during potential pullbacks.
Don’s bullish scenario depends on SOL reclaiming the descending trendline. If that happens, the analyst identifies $166 and $378 as potential upside targets. These are conditional chart targets, not guaranteed price outcomes.
The opposite scenario would weaken the setup. Don says a move below the $80-$95 support zone would invalidate the bullish structure. Traders watching this setup therefore have two reference points: trendline resistance above and support below.
CoinGecko’s latest figures show SOL trading at $104.84, with $2.66 billion in 24-hour trading volume. The token has fallen 1.29% over 24 hours and 4.41% over seven days.
For investors, Solana’s network performance and SOL’s price structure represent different measures of the ecosystem. Higher throughput and cheaper transactions may support adoption, but they do not guarantee token appreciation.

