



TLDR
- Solana trades near $103 after climbing back from a low around $60
- SOL just closed its first green monthly candle in ten months
- Monthly MACD and RSI signals point to improving momentum
- Traders are watching $120 and $146 as the next resistance targets
- Solana’s network handled $14.7 billion in tokenized asset trading over the past year
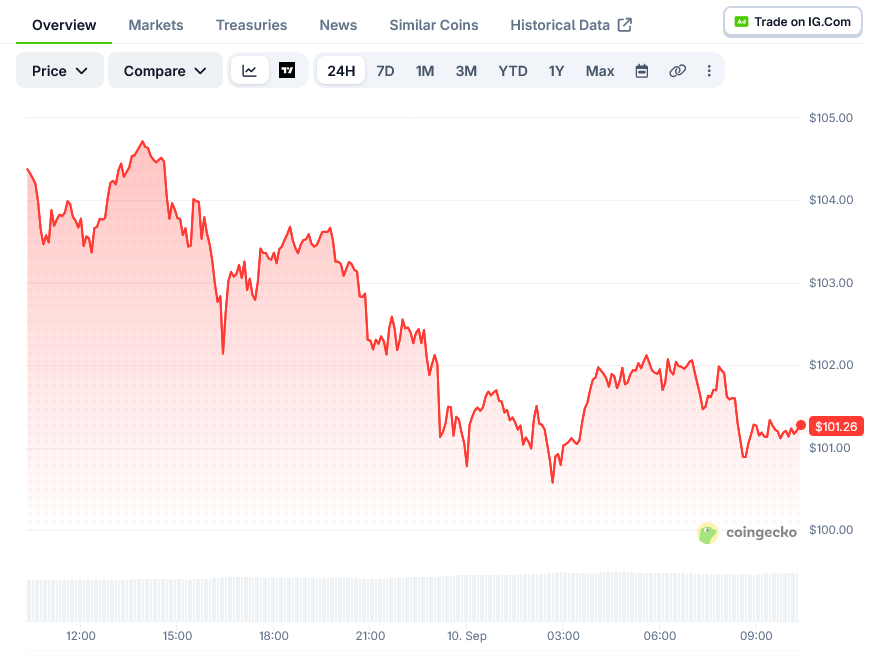
Solana is trading near $103 after climbing back from a low around $60. The token slipped about 0.18% over the past 24 hours, based on data from Brave New Coin.
The price move comes alongside a shift in longer term momentum. Traders are now watching whether Solana can hold above key support and push toward higher resistance levels.
Momentum Indicators Turn Higher
Solana closed its first green monthly candle in ten months. That follows a long stretch of selling pressure that pushed the price down through most of the year.
Analyst Ash Crypto pointed out that the monthly MACD is nearing a bullish crossover. The monthly RSI has also broken above a downward trendline that had held for close to two years.
Neither signal alone confirms a full trend change. Together they suggest the broader bearish pattern may be losing strength.
If the MACD crossover confirms while Solana holds above $100, that would add support to the case for a longer recovery taking shape.
On the daily chart, Solana already broke through the $97.70 resistance level. That former resistance now acts as the first layer of support under the price.
Analyst Ucan Coin marked $120.23 as the next resistance zone. A move through that level could open the door toward $146.56.
As long as Solana stays above $97.70, the recovery structure holds. A drop below that level could pull the price back toward $81.35.
Long Term Chart Shows a Bigger Pattern
A wider view of the Solana chart shows what analyst CryptoCurb describes as a large flag pattern. It formed after the sharp rally from the 2023 lows.
CryptoCurb suggests a breakout from the pattern could eventually lead to a much larger move, with a projection above $1,000. That scenario is a long way off and remains speculative.
Before that target becomes realistic, Solana would need to clear the flag pattern and recover prior highs in the $200 to $300 range. That would require a fresh expansion phase on the higher timeframe chart.
Outside of price charts, Solana’s network activity is drawing attention. The blockchain reportedly processed $14.7 billion in tokenized asset trading over the past year.
That figure represents around 32% of the roughly $46 billion in total reported real world asset trading volume tracked across crypto networks. Backpack alone generated about $1.5 billion in equity trading volume in two months on Solana.
BlackRock and Securitize accounted for close to $993 million in institutional fixed income issuance on the network. These numbers do not set the price of Solana directly, but they add to the picture of network growth.
For now, $97.70 remains the level separating a continued recovery from a deeper pullback. $105 is the next hurdle, followed by $110 and then $120.23.
A daily close above $120 would open the path toward $130 to $140 before $146.56 comes into focus. That remains the level traders are watching most closely as the next test for Solana’s recovery.

