



TLDR
- TSLA stock gained 3.80% to $339.96, extending its five-day advance to 6.39%.
- Tesla moved above its 20-day SMA at $331.07 but remained below the 50-day SMA at $372.71.
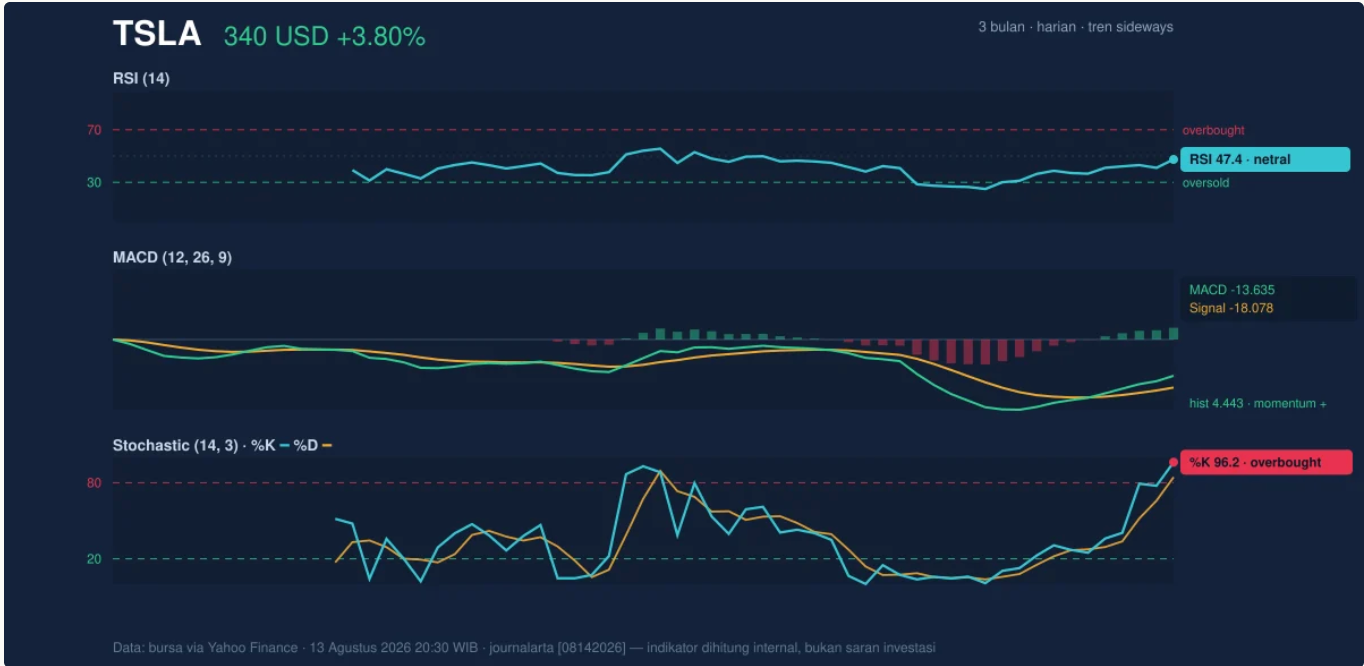
- MACD momentum improved, with the line moving above its signal line and the histogram turning positive.
- RSI stayed neutral at 47.4, while the stochastic oscillator moved into overbought territory.
- Trading volume remained below the 20-day average, keeping participation weaker than the latest price gain.
- Tesla continues to trade between key support at $298.32 and resistance at $380.84.
Tesla (TSLA) shares moved higher on Nasdaq on August 13, 2026, as TSLA stock gained 3.80% to $339.96. The advance extended its five-day rise to 6.39%, showing stronger short-term buying after a weak month. However, the stock remains down 13.07% over one month, keeping the broader recovery incomplete.
TSLA Stock Holds Above 20-Day Average
Tesla now trades above its 20-day simple moving average of $331.07. That level supports the recent rebound and shows price has recovered above its short-term average. The five-day slope of the SMA20 remains negative at 4.67%, showing the average has not yet turned higher.
TSLA stock still trades below its 50-day average of $372.71. No fresh moving-average crossover has appeared. This leaves Tesla between short-term recovery and continued pressure from the wider trend. A move toward the 50-day line would test whether buyers can extend the rebound.
Tesla’s RSI stands at 47.4, placing momentum in neutral territory. The reading shows neither buyers nor sellers control the market clearly. The stochastic oscillator gives a different signal, with %K at 96.2 and %D at 84.3, placing short-term momentum in overbought territory.
MACD shows improving conditions despite remaining below zero. The MACD line stands at -13.635, above the signal line at -18.078. The histogram is positive at 4.443. These readings show downside momentum has eased while recent price strength has increased.
Volume and Key Tesla Stock Levels
TSLA stock traded 34.58 million shares, below its 20-day average volume of 39.12 million. The session reached about 0.9 times normal volume. Rising on-balance volume shows cumulative buying pressure has improved, even without a large increase in daily trading activity.
Bollinger Band data also shows Tesla trading above the middle of its range. Its %B reading of 59% places price away from the upper band. Bandwidth stands at 29.6%, while ATR is $10.97, or about 3.2% of price. The readings point to active price movement without placing Tesla near the top of its volatility range.
Tesla remains above support at $298.32 and below resistance at $380.84. The three-month low stands at $297.38, while the three-month high is $451.98. Holding above $331.07 would keep the short-term recovery intact. A move toward $372.71 would bring the 50-day average into focus, while a drop below $298.32 would place the three-month low back in view.
Get 3 Free Stock Ebooks
Discover top-performing stocks in AI, Crypto, and Technology with expert analysis.
- Top 10 AI Stocks - Leading AI companies
- Top 10 Crypto Stocks - Blockchain leaders
- Top 10 Tech Stocks - Tech giants


